Agricultural detail at scale

Predictive intelligence for land, pasture and crop.

Agricultural detail, at scale.

Radar satellites, machine learning and agricultural forecasting, fused into a model of every field. From a single paddock to a whole supply chain.

Working with
AHDBEIT FoodThe UK Agri-Tech CentreInnovate UKDefraSatellite Applications CatapultGitLabAWSGoogleCloudFerro
Source AI · supply chain visibility

Know where your ingredients come from, and how those fields are growing this week.

Source AI maps each material back to the farms and plots behind it. Our radar models of every field show how those origins are growing, so supply risk shows up before it reaches you.

Collect supplier origin declarations, review sourcing risks and map ingredient exposure in one place, with multilingual supplier workflows and annual updates.

Book a pilot-scoping call →See a scenario

For procurement, R&D and sustainability teams collecting origin information from their suppliers.

The origins map in Source AI, showing declared ingredient origins across South America, West Africa and Northern Europe.
The whole chain

From the product you buy to the field it grows in.

Most traceability stops at a supplier declaration. Agribot keeps going, to the condition of the land behind it.

01

Material

A product you buy from one supplier, with its code and yearly volume.

A fat blend

Source AI
02

Ingredients

What it is made of, in shares that add up to 100%.

Palm olein 70%, soybean oil 30%

Source AI
03

Origins

Where each ingredient comes from, with its share of the year's volume.

A mill, a port or a growing area

Source AI
04

Farms and plots

The cooperatives, farmers and plots behind each origin.

The supply behind it

Source AI
05

Fields, this week

Measured by radar through cloud, every few days.

growth · crop stage · harvest

Pasture AI · Crop AI
Source AIDeclared by your suppliers, checked, then approved by your team
Pasture AI · Crop AI
Source AI

Map, check and plan your sourcing footprint.

Annual sourcing-footprint mapping. Map supplier-declared ingredient origins and their share of each material's annual volume, with origin checks and recorded buyer approvals. This is origin-level mapping, not shipment- or batch-level tracking.

01 Map

From the product you buy to the origins behind it.

Suppliers answer in their own portal, in their own language. Each sees only its own materials. They upload plots as GeoJSON, KML, Shapefile or a spreadsheet.

Origins belong to the supplier's whole group, so a sister company can reuse them. Next year, approved answers carry forward and suppliers confirm only what changed.

The supplier portal, where a supplier splits a year's fish oil volume between two declared origins.
Supplier portal · where it comes from
02 Check

Check declared origins before approving them.

A

Geospatial checks

Check whether submitted plots fall within the declared country and flag overlaps for review.

B

Satellite-based checks

Land use, and possible deforestation after 31 December 2020, flagged for review.

C

Supplier evidence and your approval

Suppliers attach supporting documents, such as certificates. Your team reviews the evidence and check findings, requests corrections and records approvals, with a history of who did what and when.

A buyer reviewing a cocoa submission, with two plots flagged for failing their checks.
Reviews · a flagged origin

Checks flag a declared plot's characteristics for review. They don't, on their own, prove that an ingredient came from that plot.

03 Plan

See where your supply is exposed before disruption happens.

Scenarios work from what suppliers declared: the tonnes each origin supplies to each ingredient. Trying one changes nothing, so anyone with access can explore.

01

What happens if a country's supply stops?

02

What if one supplier, or a whole group, can't deliver?

03

How much depends on answers nobody has approved yet?

What you learn
Which ingredients and materials depend on one country or supplier, and how much volume is exposed.
What you do next
Identify other declared origins for the same ingredient and prioritise contingency planning.
What happens if a country's supply stops?Illustrative example
3,020 t
Declared volume exposed
of 7,700 t declared
39.2%
Share of declared volume exposed
5
Ingredients with no other declared origin
0
Ingredients with reduced declared supply

If supply from one country stops, 3,020 t of the 7,700 t declared would be exposed, and five ingredients would have no other declared origin.

A supply scenario where one country's supply stops, showing exposed volume and the ingredients left with no other declared origin.
Sourcing · scenarios
For your team

Less chasing, clearer accountability.

What it does
What it changes for your team
Supplier portal in their language, with answers carried forward each year
Less repeated supplier administration
Recorded reviews and approvals
Clear accountability for accepted sourcing information
Country and supplier disruption scenarios
Visibility of concentration and potential supply gaps
Excel and CSV exports, and a read-only data feed
Use the information alongside your existing reporting systems
Powered by field intelligence

The same models farmers use, behind every origin.

Pasture AI and Crop AI were built field by field on working farms, and are products in their own right. They are what lets Source AI see past the declaration.

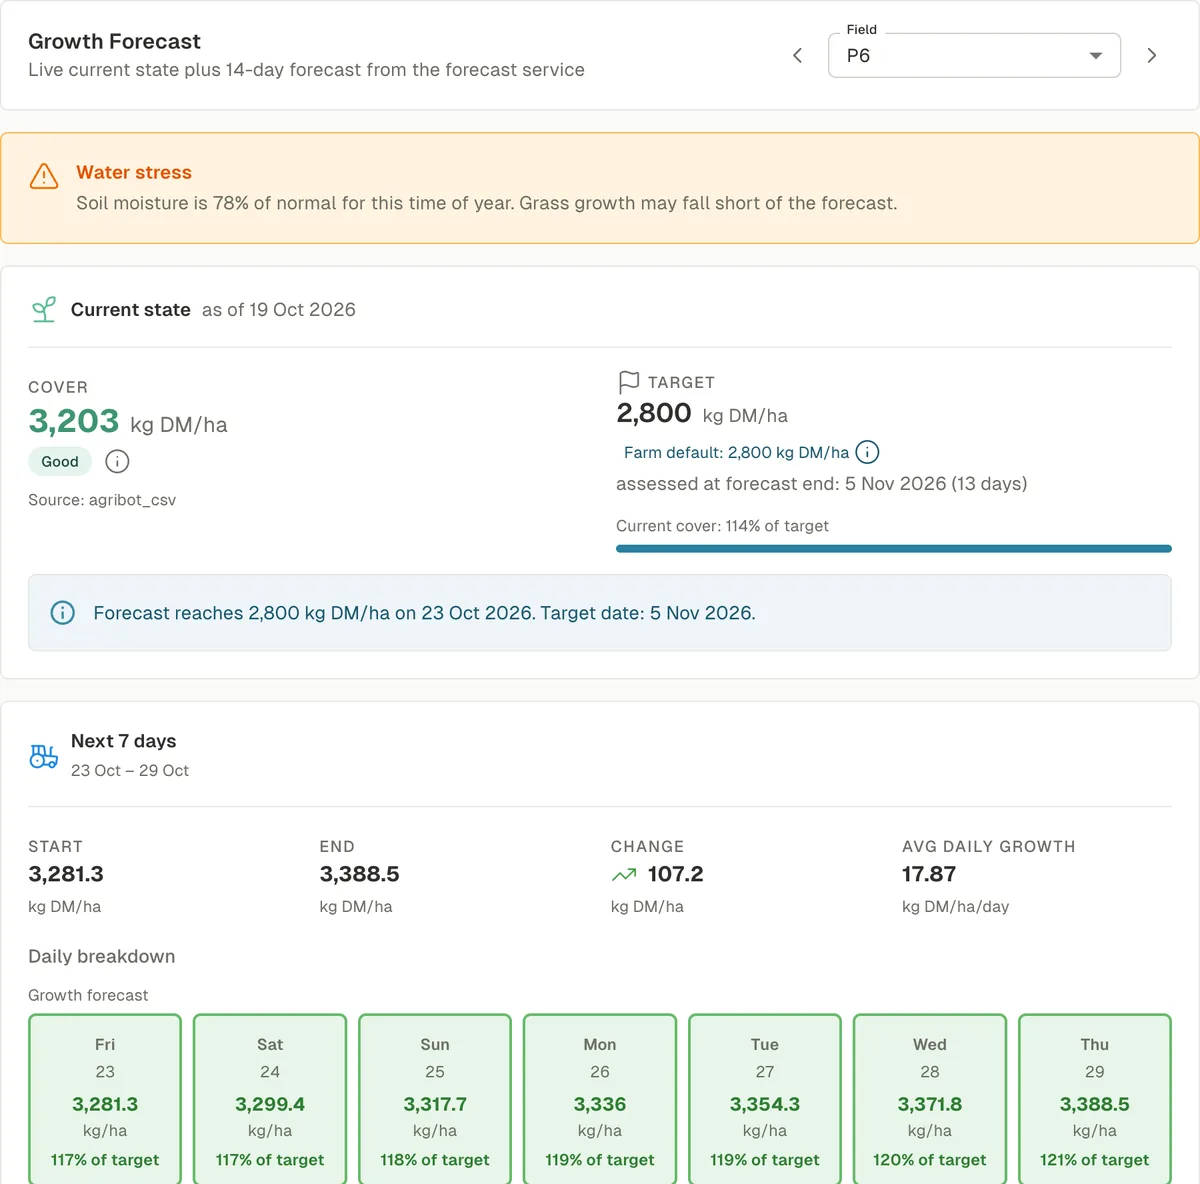
Pasture AI growth forecast chart for a field.
Pasture AI

A grass growth forecast for every field.

Dry-matter yield two weeks out and growth trends four weeks ahead, for the grazing systems behind dairy and meat supply.

90%
accuracy on English farms
15 days
average warning of extreme weather
Explore Pasture AI
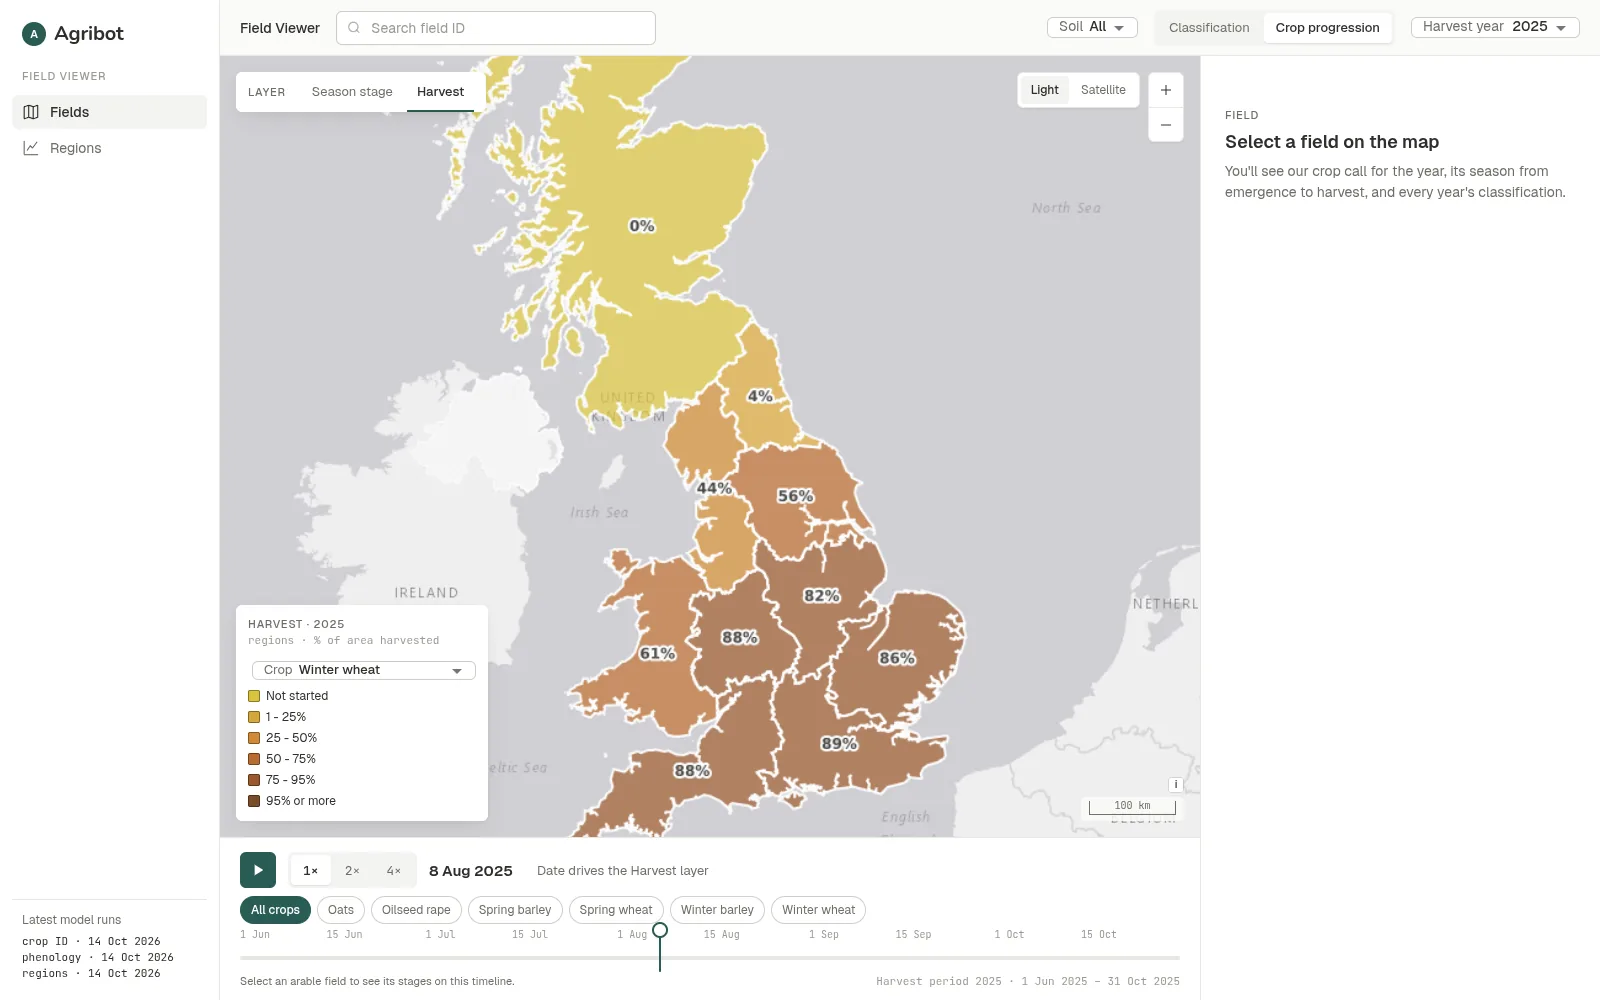
Crop AI national harvest layer showing the share of winter wheat harvested in each region of Great Britain.
Crop AI

What's growing, how it's developing, when it's cut.

The crop in every field, each stage from emergence to harvest, and how this year compares with every year since 2017.

1.6M
fields in Great Britain
94%
of area correctly classified
Explore Crop AI
What it adds to your sourcing footprint

Growth at your origins

Grass and crop development in the regions you source from, against previous seasons.

Early warning

Growth and production shortfalls flagged weeks before they reach volumes.

Harvest timing

When the crop behind an origin is cut, and how that compares with every year since 2017.

Start with a pilot

Explore a pilot for one priority ingredient category.

Agree the supplier scope, assess origin coverage and test the approval and exposure workflows. Measure supplier response rate, declared-origin coverage, unresolved flags and time to review.
Book a pilot-scoping call →