Every field.
What's growing, how it's developing, and when it's cut.
Satellites already see every field on Earth every few days. Agribot turns those images into answers for each field: the crop it is growing, every stage of its season from emergence to harvest, and how this year compares with every year since 2017.
Zoom out and the same data adds up to regional and national progress, refreshed every few days.
Surveys are slow, sampled, and published after the decisions that needed them.
Knowing what is planted, how the season is going and when the crop comes in still mostly depends on surveys: slow, sampled, and published after the decisions that needed them have been made.
We built the system in Great Britain and checked it every season since 2018: crop areas against the national crop survey, crop calls field by field against the government's crop map, and harvest dates against the industry's weekly harvest survey. Now we're taking the same system global.
Proven in Great Britain
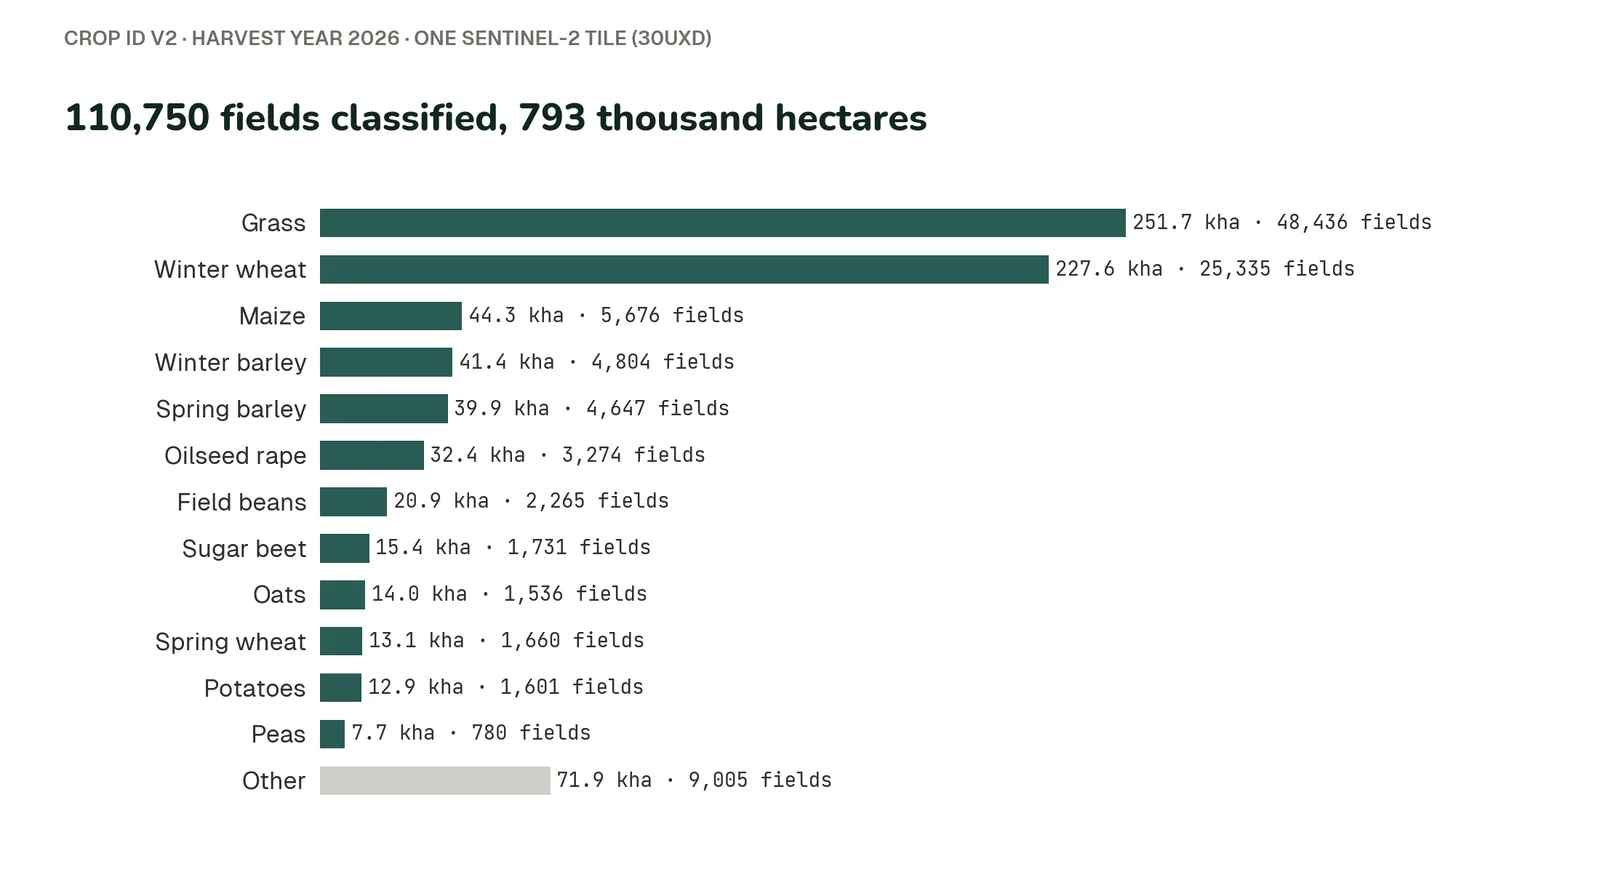
Crop calls cover more than a million fields. Regional figures rest on thousands of fields per region, not on a handful of sample farms.
In England in 2026, wheat, oilseed rape and winter barley areas were each within 1% of Defra's Cereal and Oilseed Production survey, inside the survey's own margin of error.
A national total can match even when field errors cancel out, so we check fields directly too, against the Rural Payments Agency's crop map of England. Across all classified area, 94% is correctly classified. The 86% of area called with high confidence is 98% correct, and the fields the model is unsure about are flagged as such.
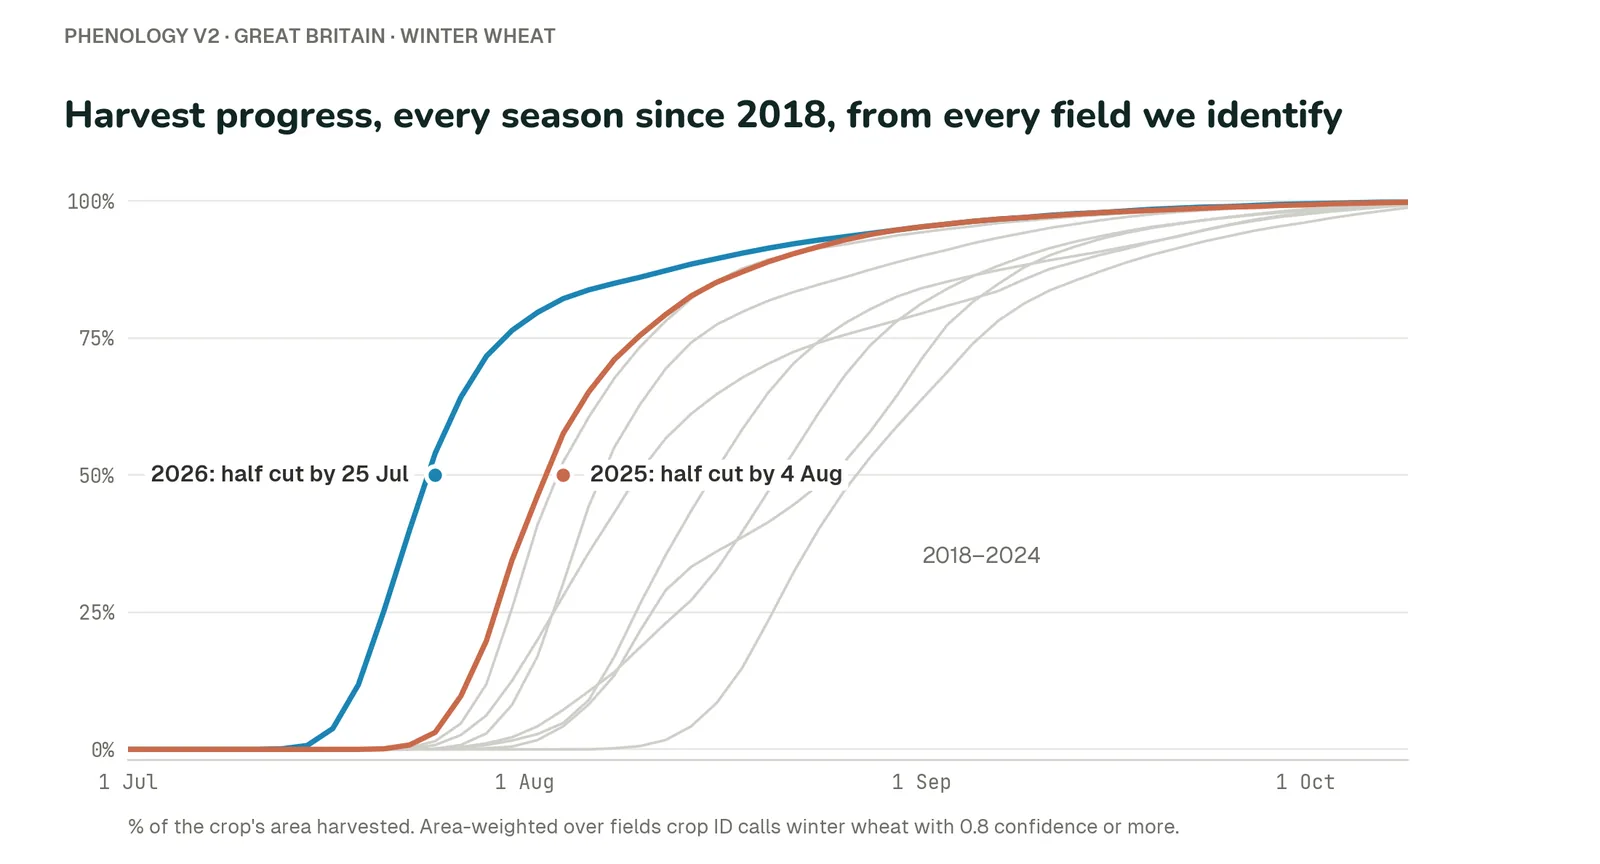
On seasons held back from tuning (2024 to 2026), the date each crop's national harvest reached halfway was a median of one day from the industry survey, and within a week for 13 of 15 crops and seasons.
Crop calls are tested on years the model never trained on, and crop areas are made before that year's survey is seen; earlier surveys are used only to calibrate. Harvest timing was tuned on 2020 to 2023 and tested on later seasons.
The same method and the same satellite record every year, so any figure can be recalculated and audited.
Here's what that looks like in practice, from a single field in the Lincolnshire fens up to the national harvest.
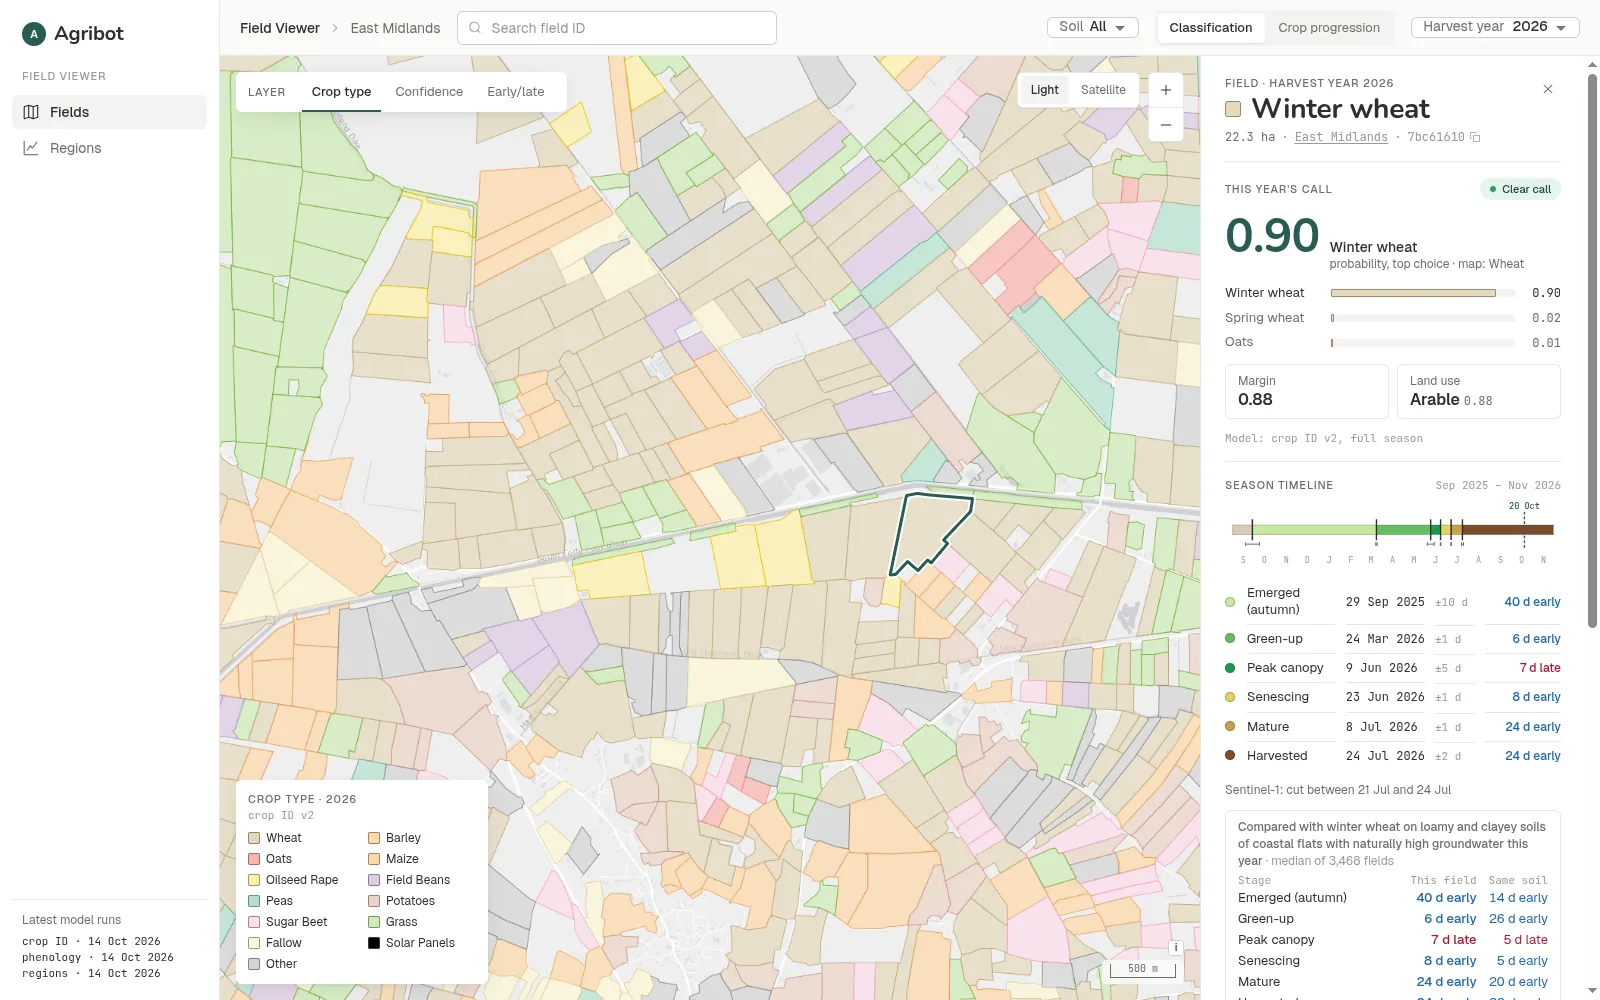
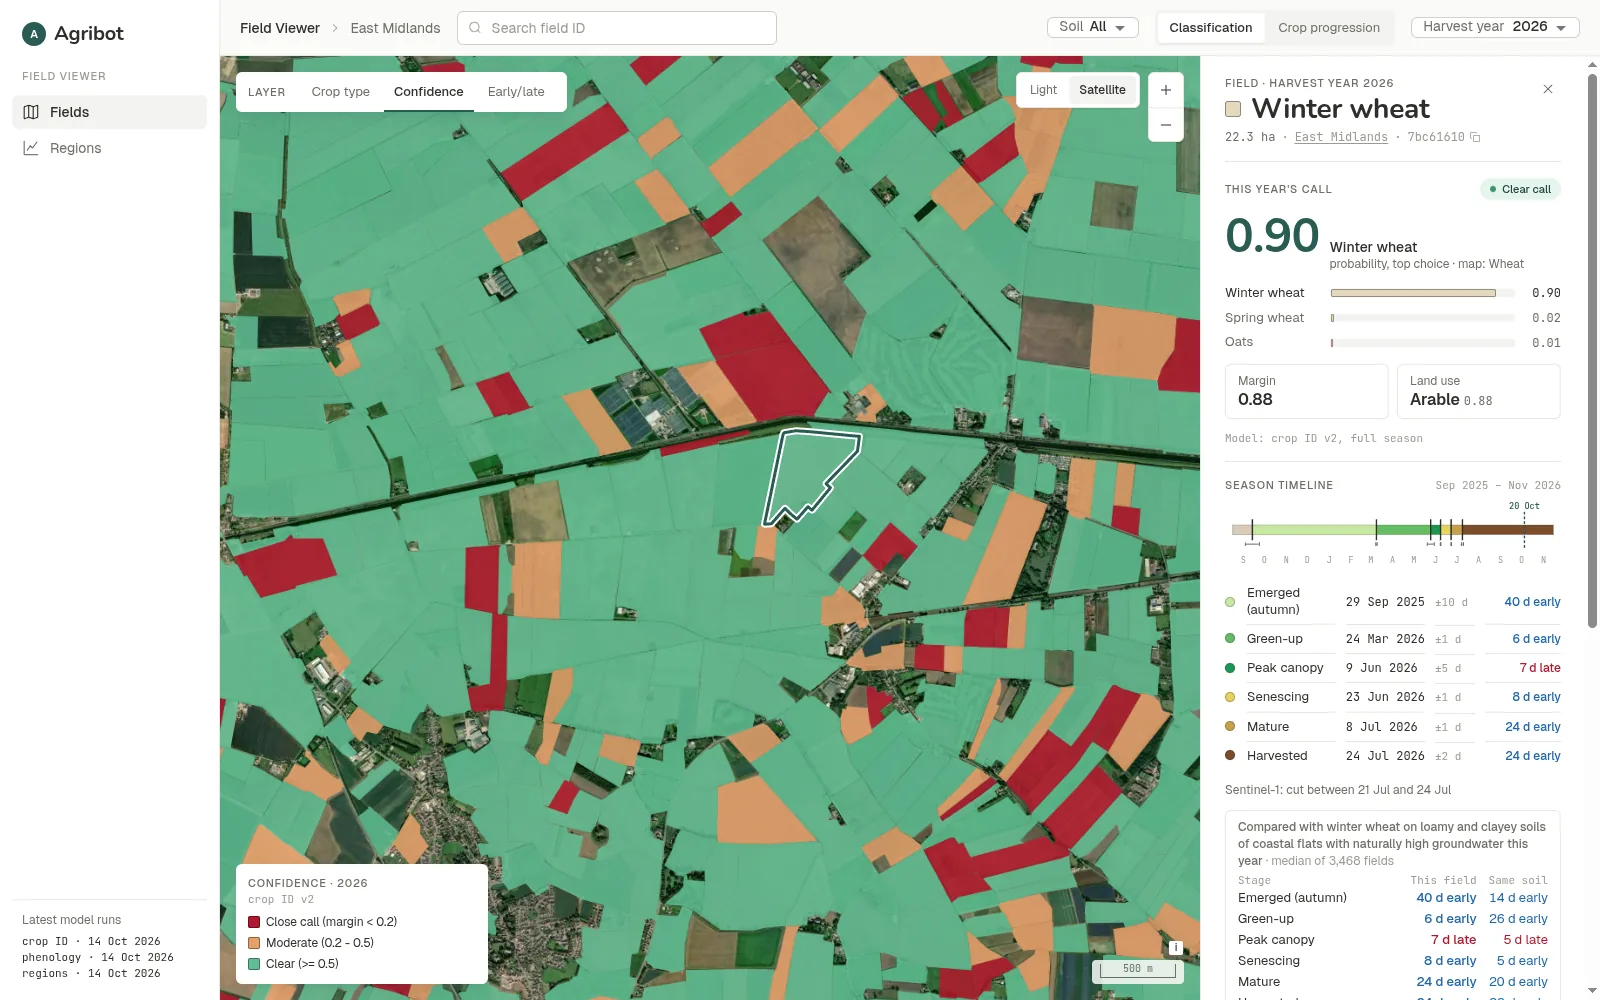
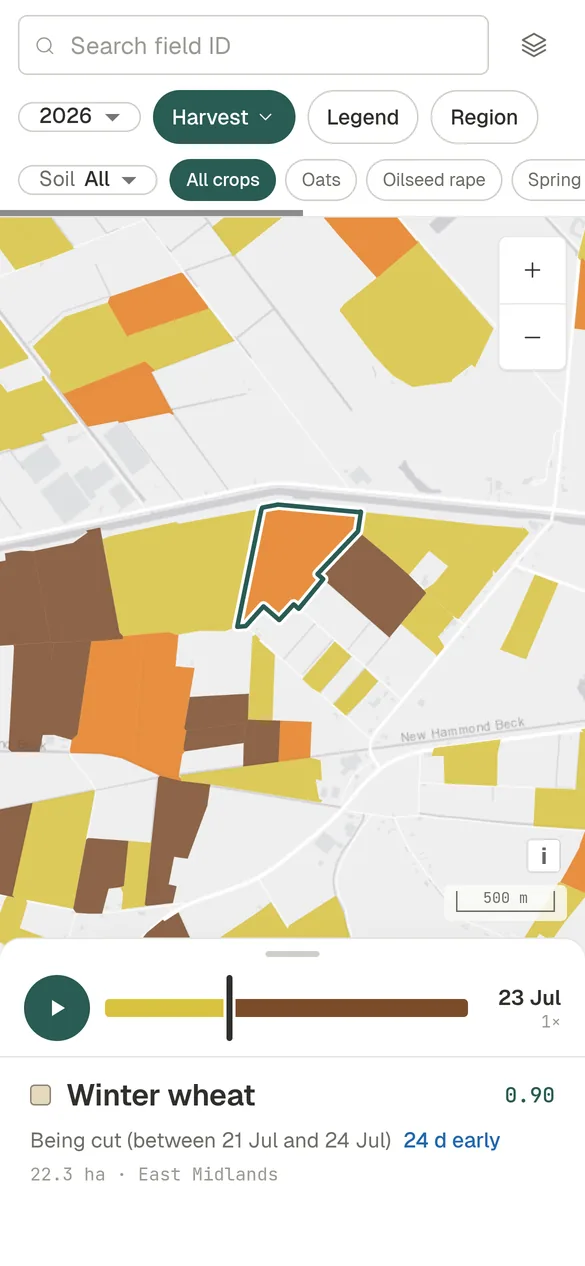
Click one, get the whole story.
This year's crop
With the model's top three choices and their probabilities. A close call is flagged, never hidden.
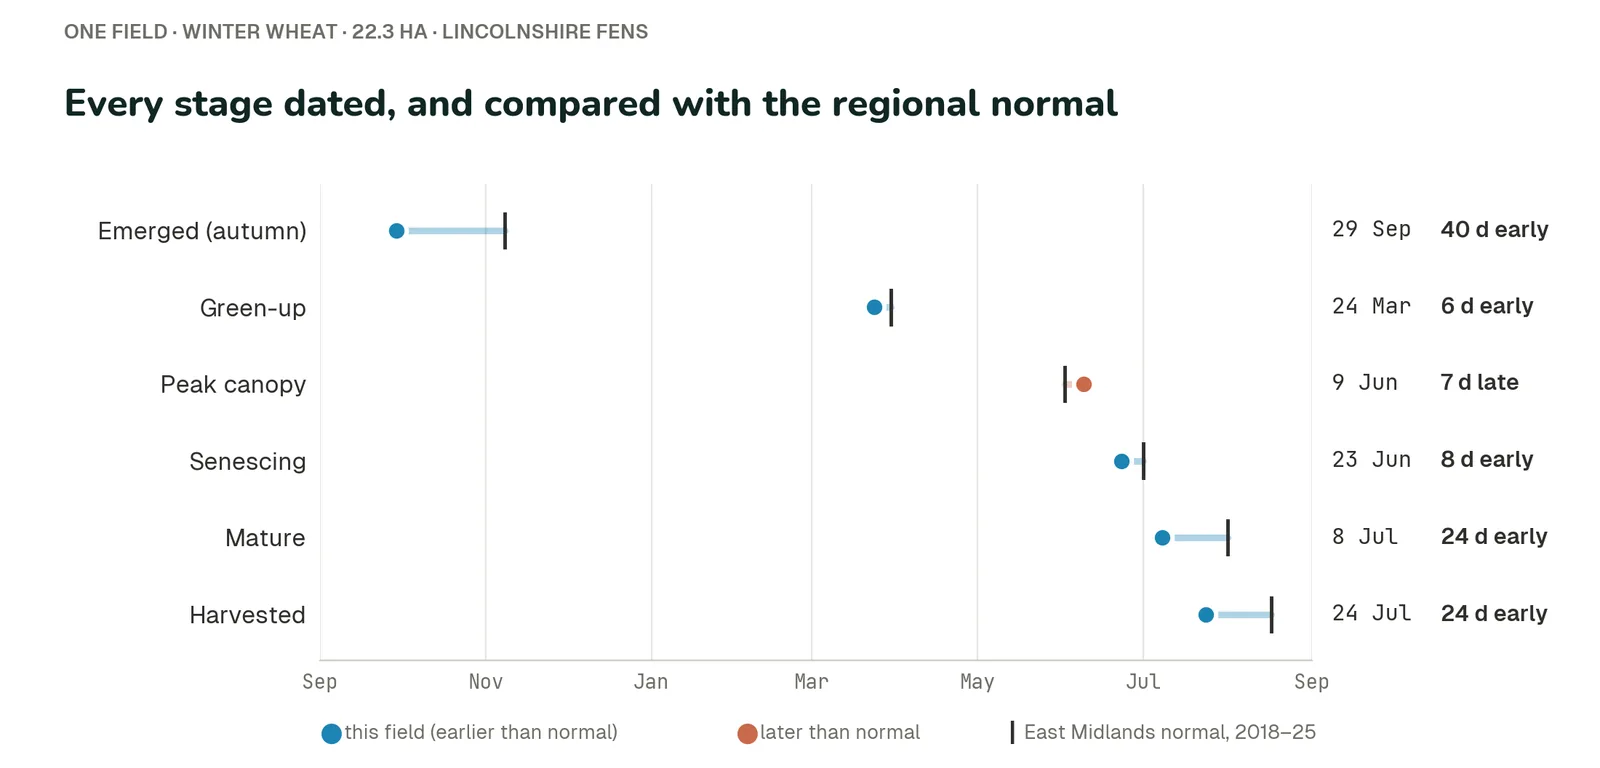
The season timeline
Emergence, green-up, peak canopy, senescence, maturity and harvest, each dated and set against the regional normal.
Its neighbours
The same crop on the same soil type this year.
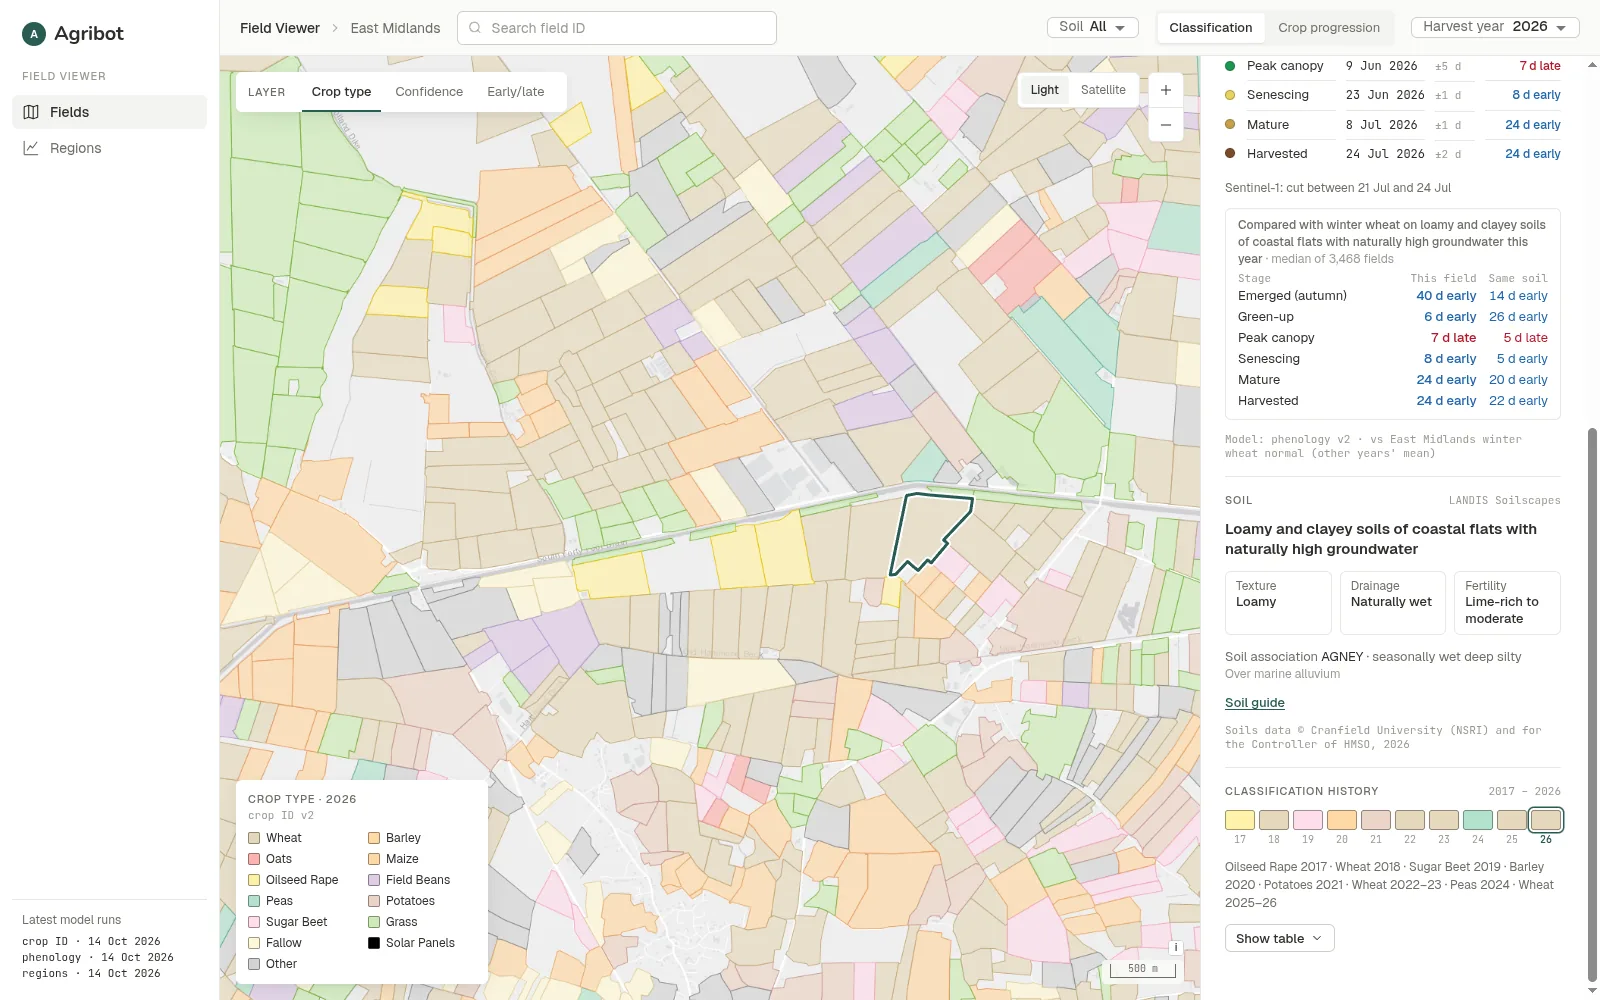
The soil
From the best soil map available for the country.
Its rotation history
Every season the archive covers. In Great Britain, 2017 to 2026.
For an insurer or lender, that's an independent record of what a field grew and when it was cut, going back years.
Watch the season move.
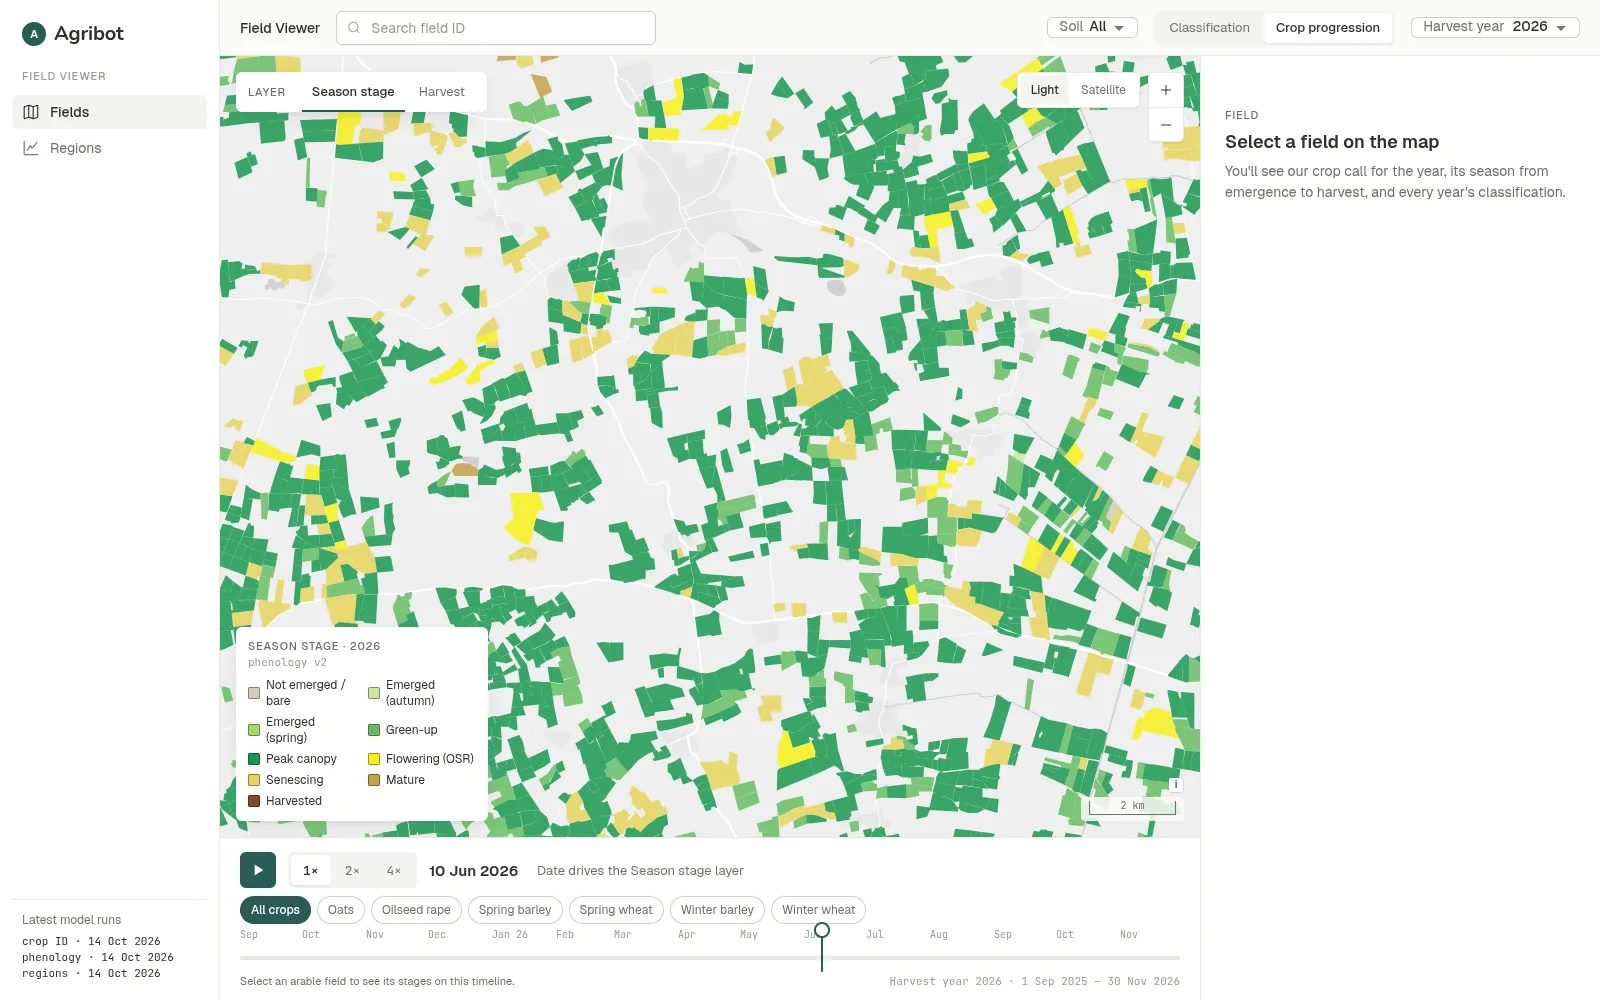
Season stage
The same scrubber drives the season stage map: which fields have emerged, greened up, reached peak canopy, flowered, ripened or been cut, on any date.
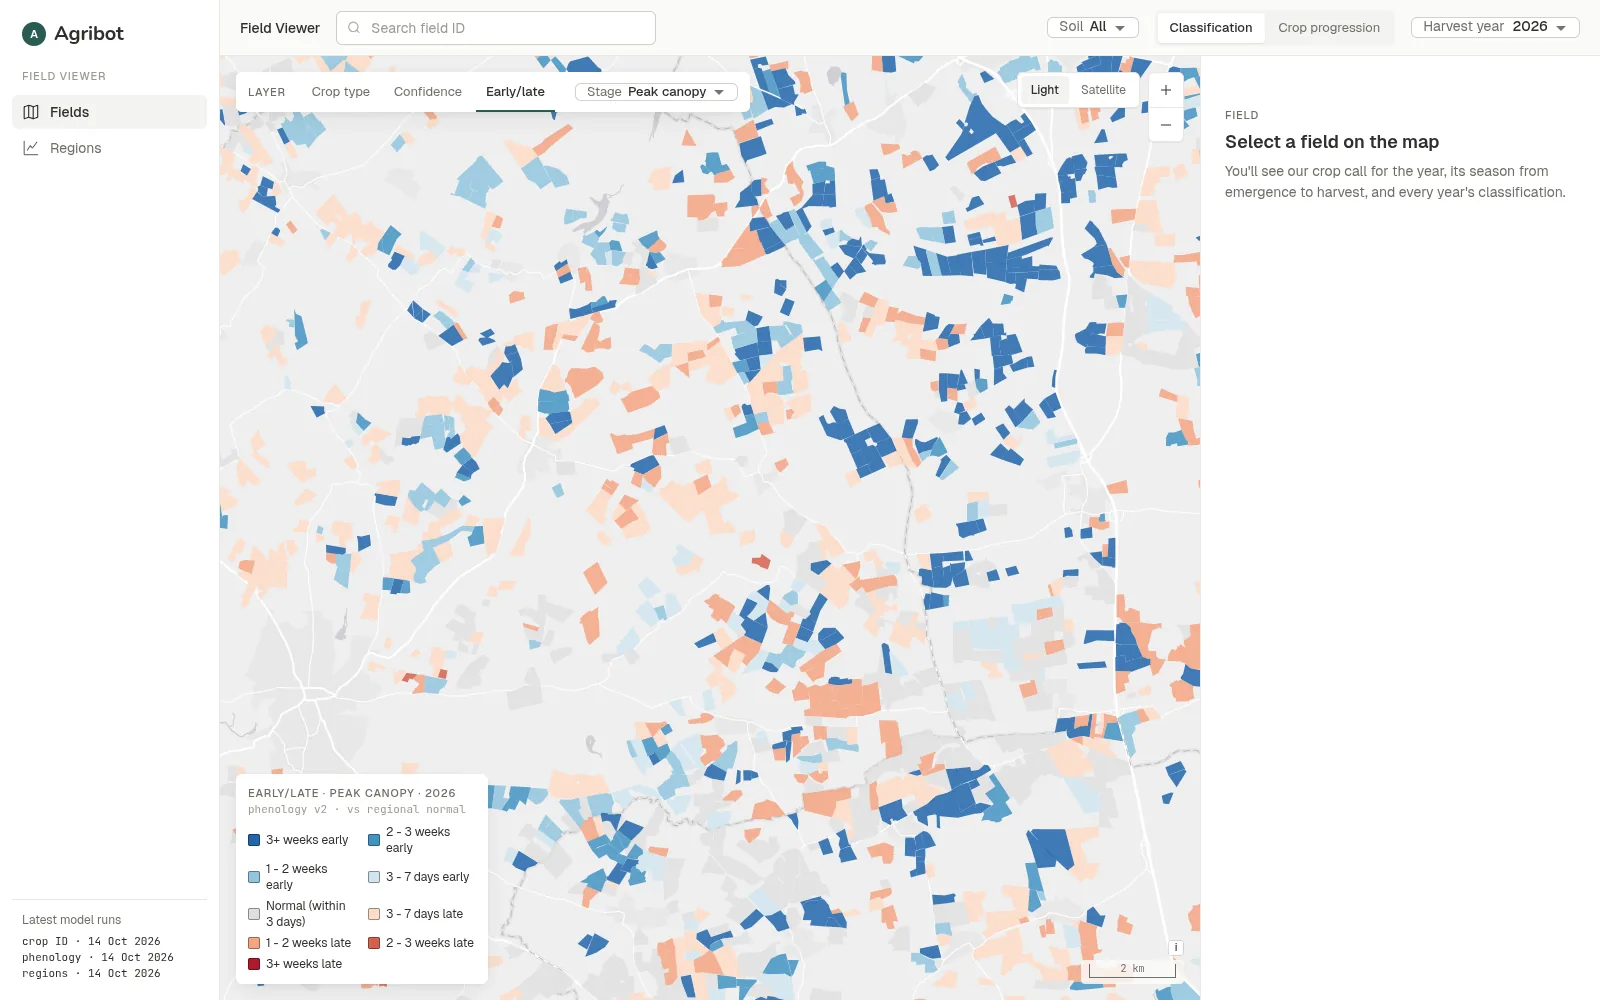
Early/late
Colours every field by how many days it is ahead of or behind the regional normal, so an adviser knows which fields to walk first.
Confidence
Shows where the crop call is clear and where it is a close call, so it's plain which figures to lean on and which fields are worth a check.
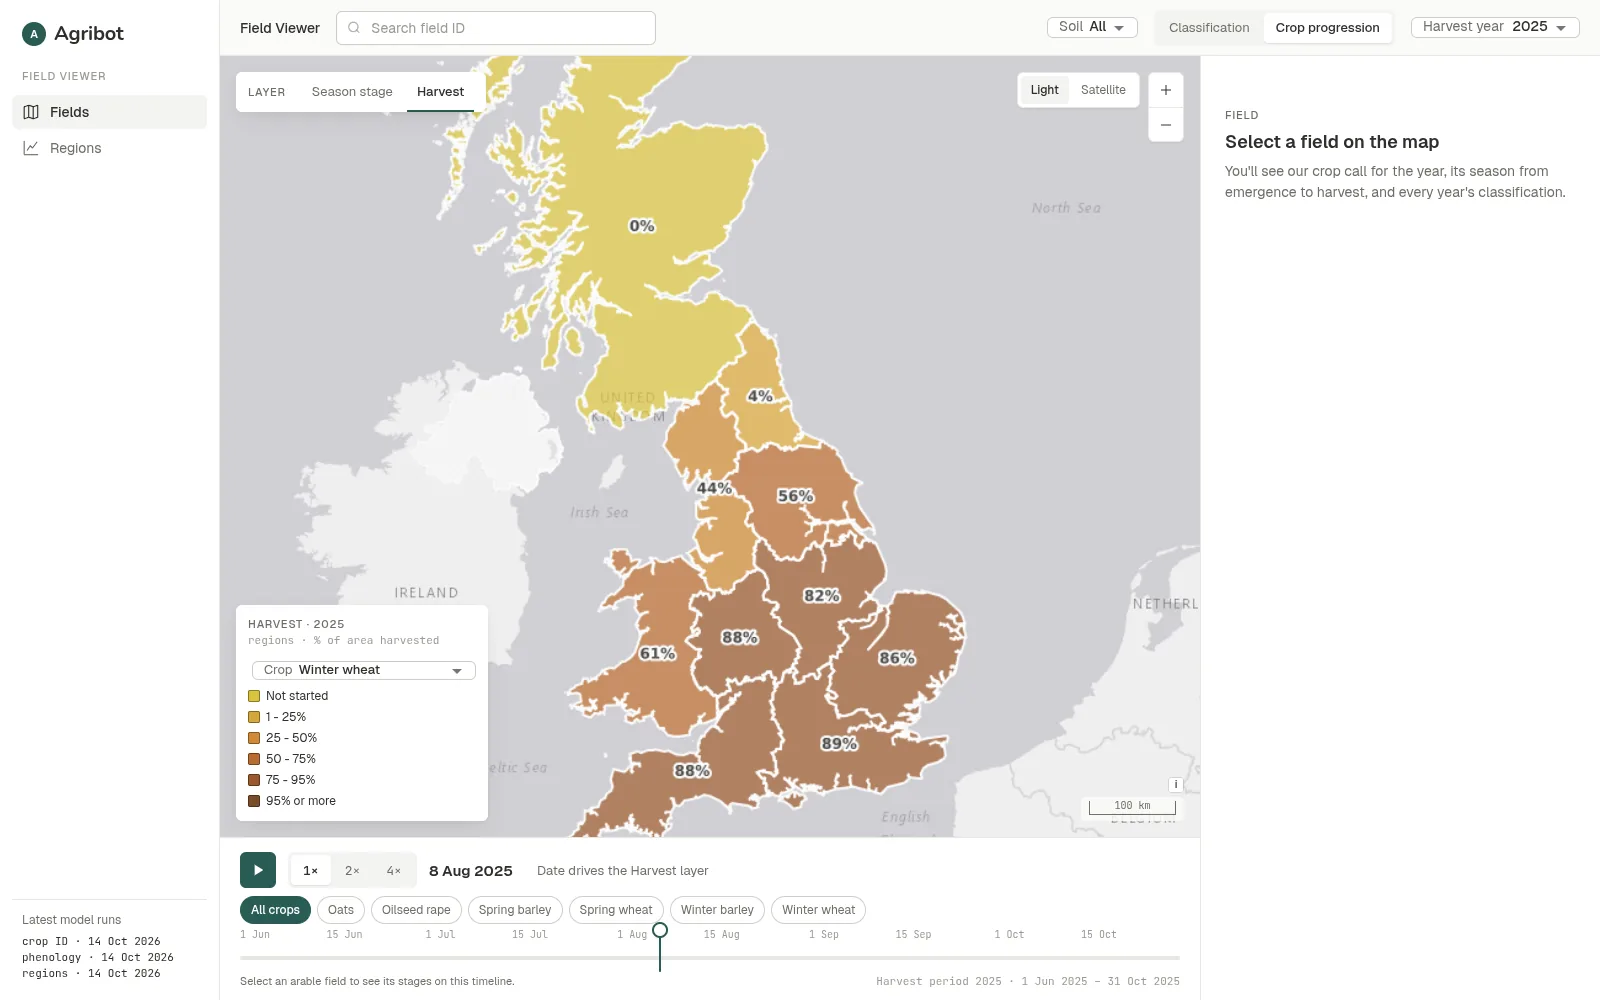
Pick a date and drag the scrubber, or press play. Every field shows as standing, being cut or harvested. Radar sees through clouds, so harvest is picked up even in a wet week, which matters as much in a monsoon as in an English July.
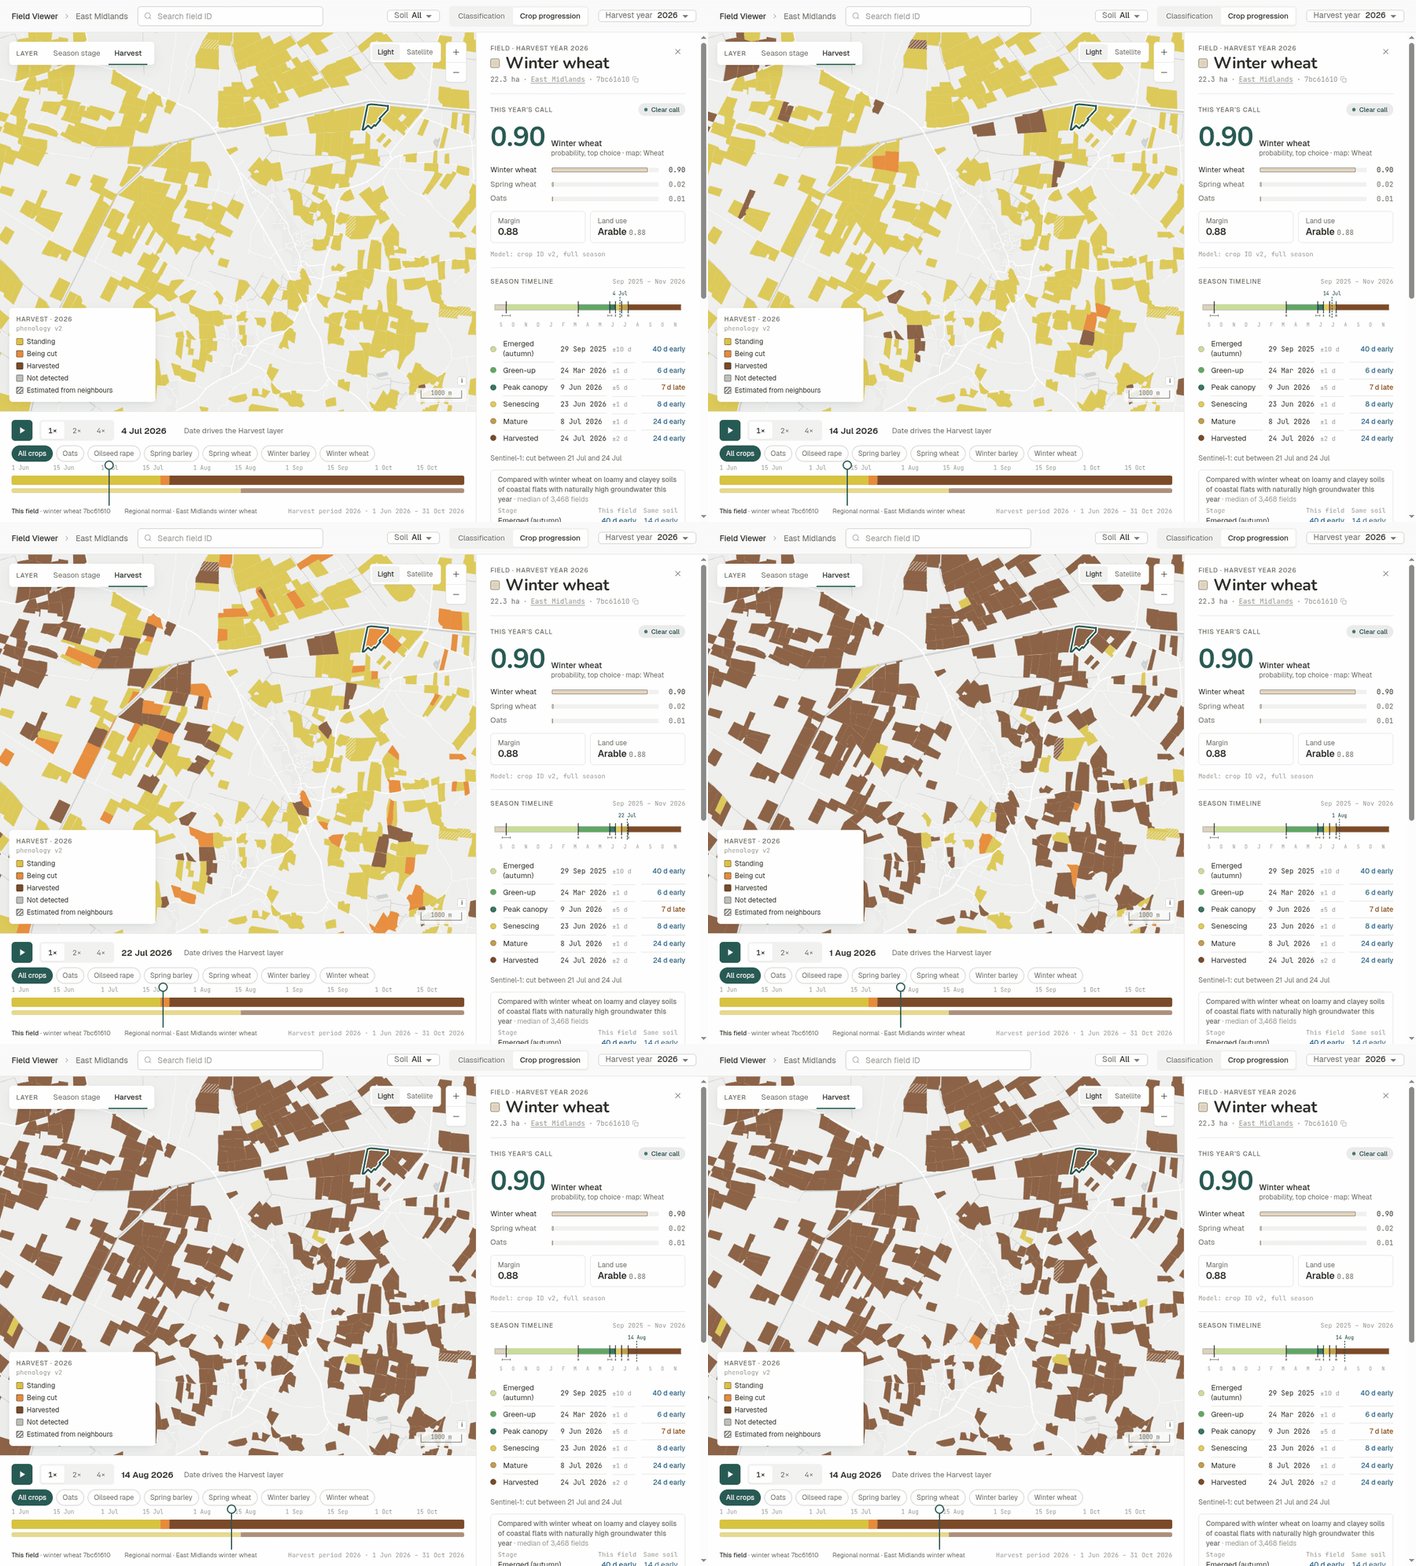
For a grain buyer, that's seeing the harvest advance across sourcing regions within days, not weeks.
Regional and national progress, on any date.
Zoom out, and the map switches to regions: the share of each crop's area harvested, on any date. Regions can be whatever boundaries matter: provinces, states, districts, catchments or a supply area.
The Regions page sets each region's season against every other year: harvest and emergence curves, the timing of each growth stage against the normal, whether heavy or free-draining soils ran early or late, and the crops grown on each soil.
Because every season is rebuilt from the satellite archive with the same method, years compare directly.
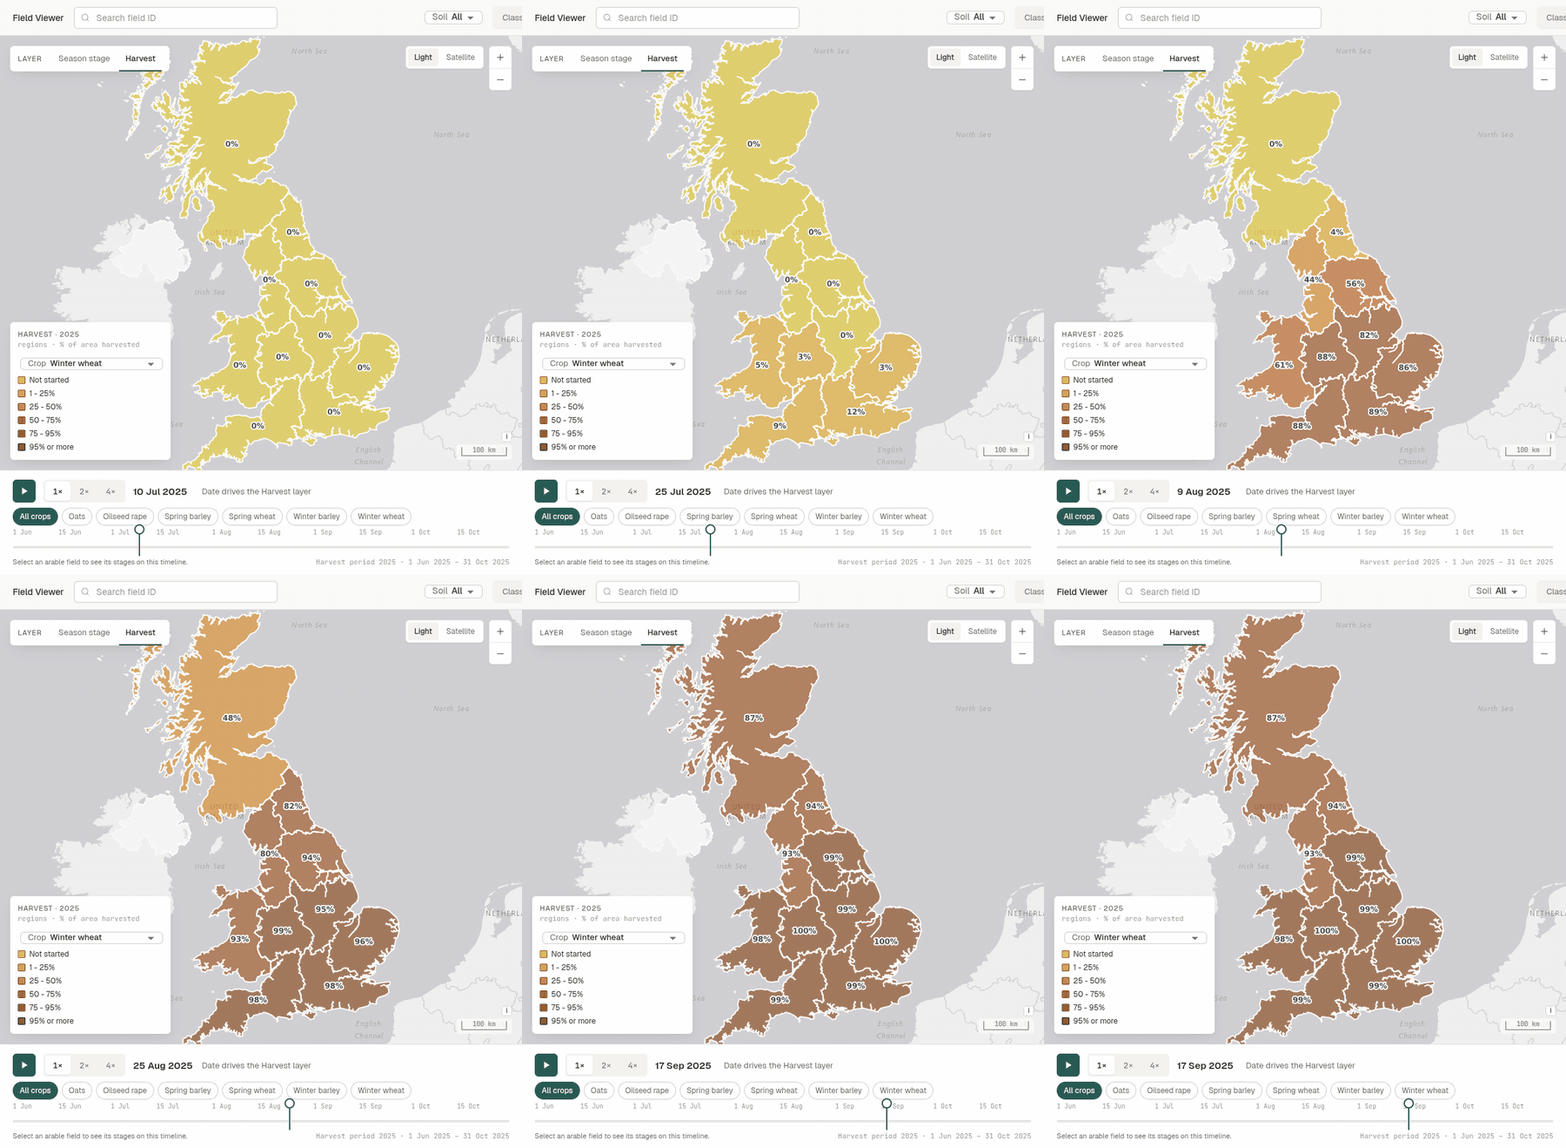
For a ministry, that's regional crop progress during the season, not after it.
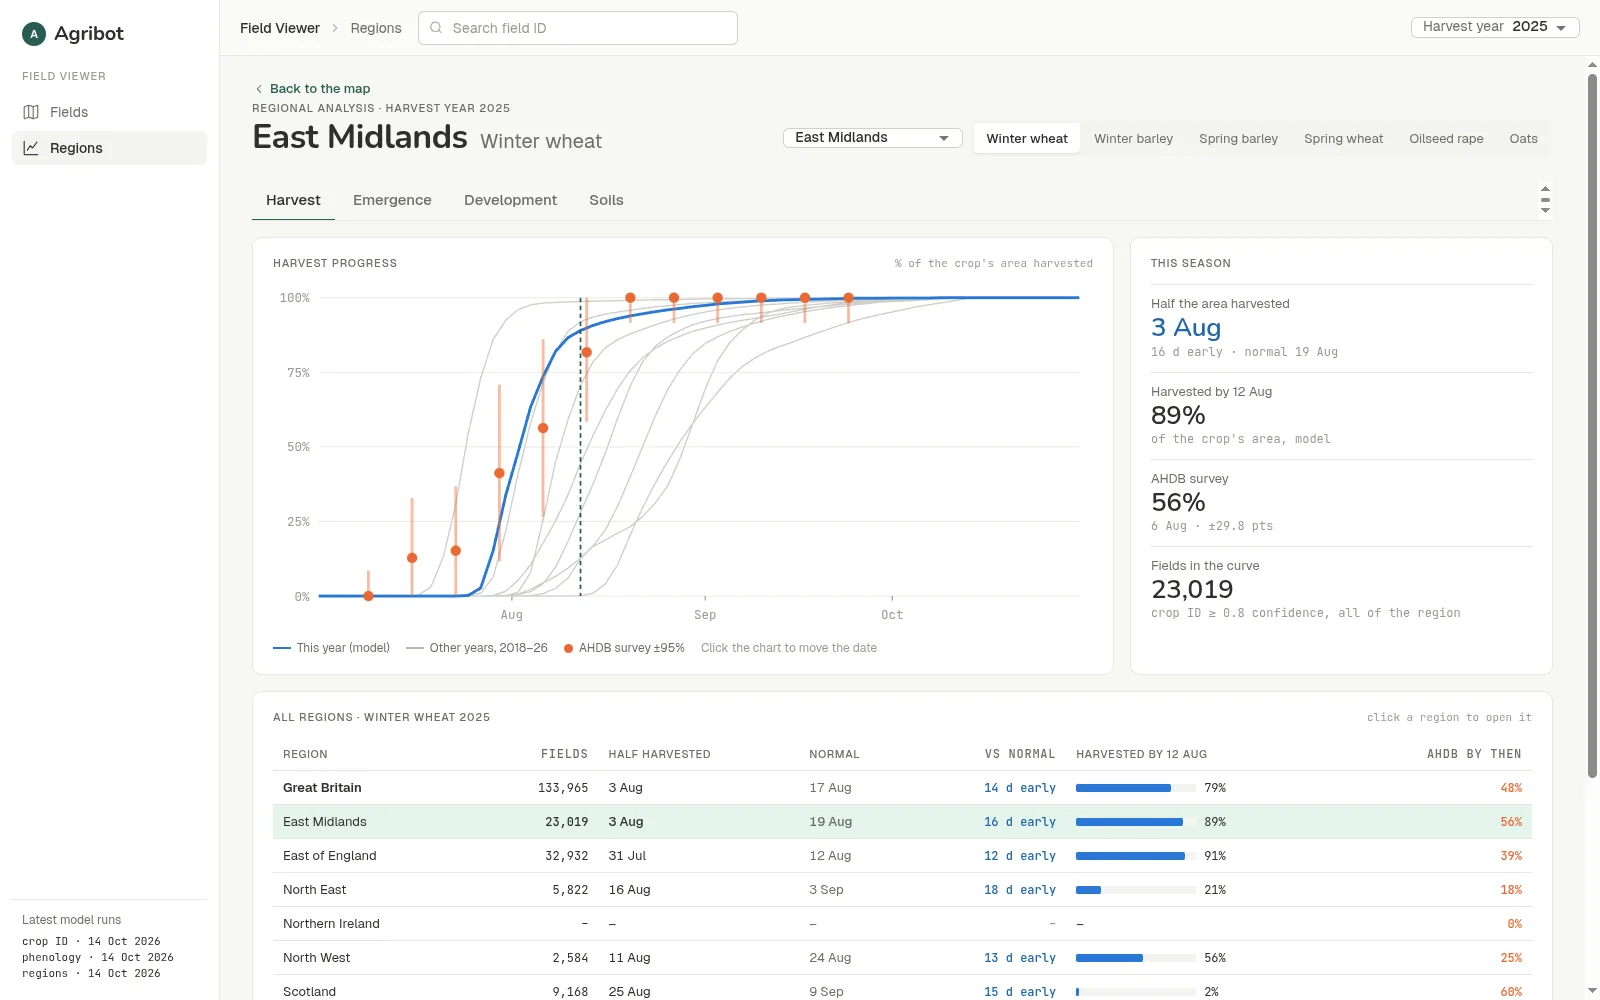
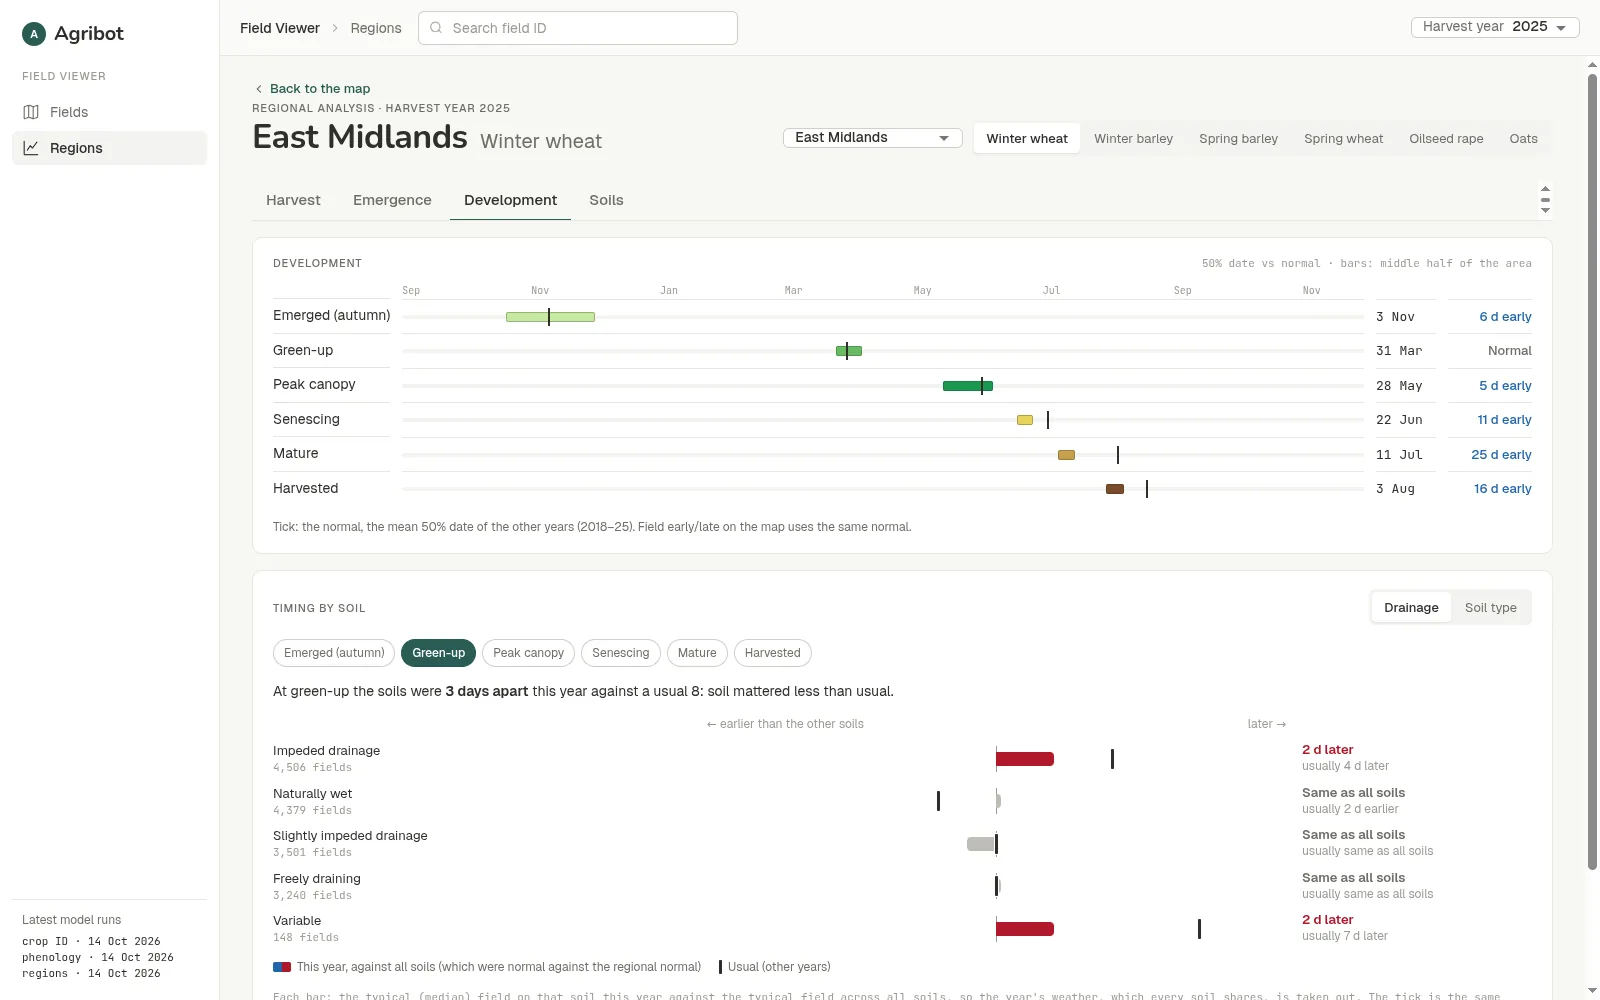
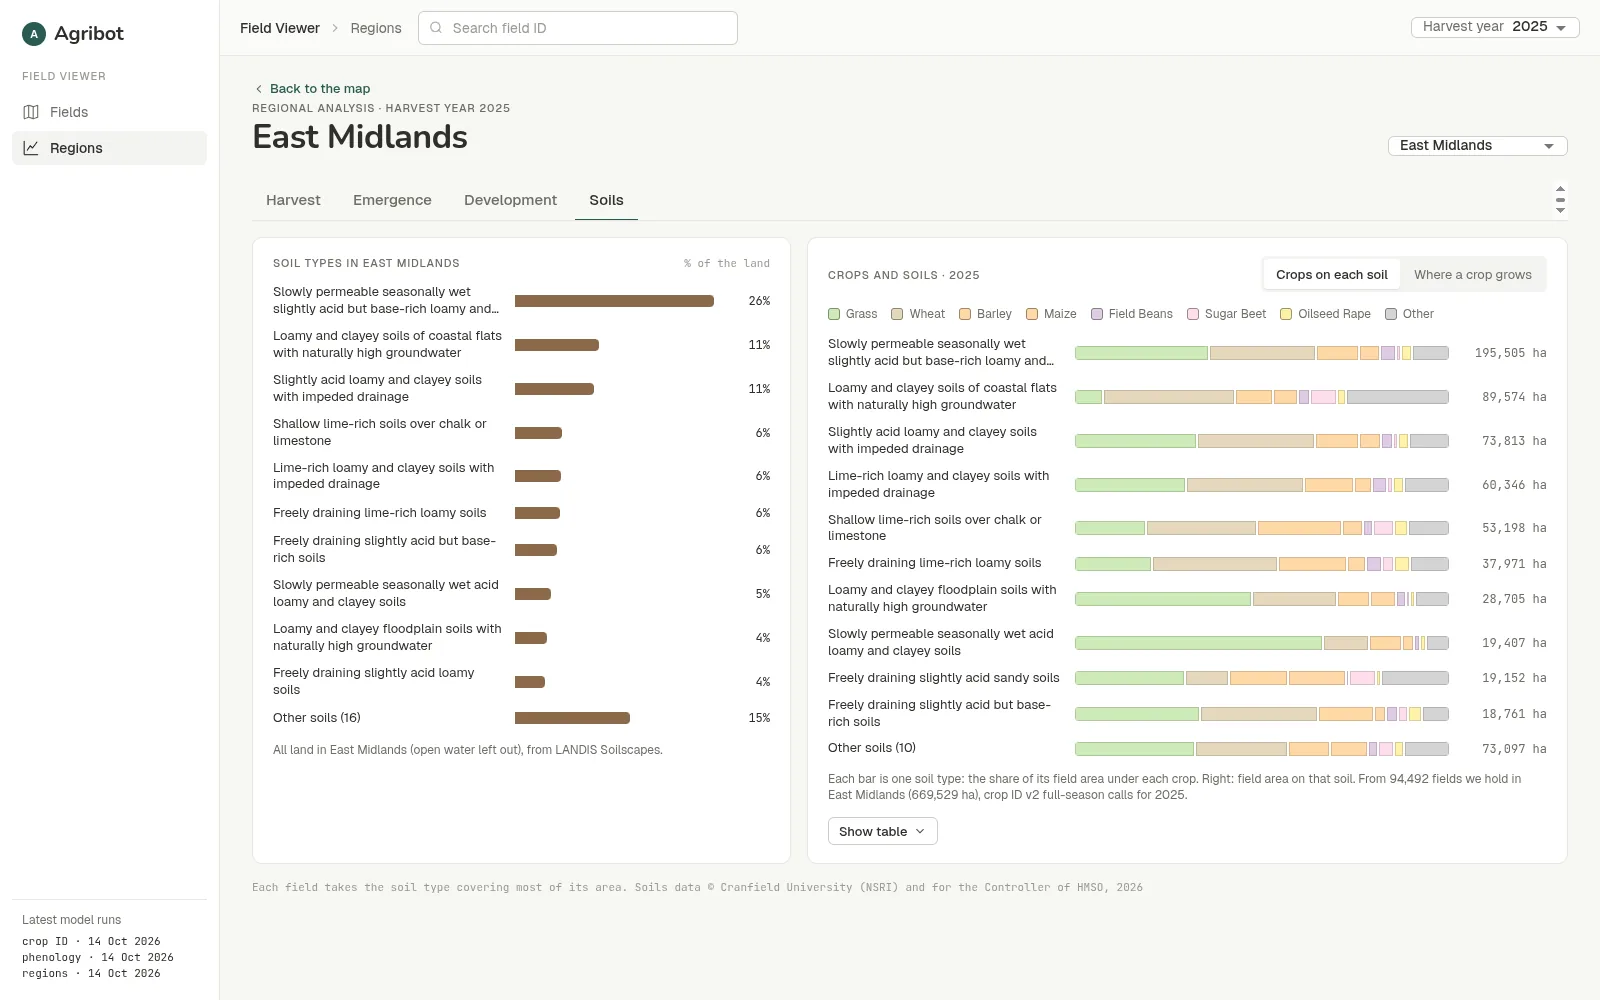
From satellite pass to field-level answers.
Observe
Sentinel-2 measures how green each field is every few days; Sentinel-1 radar sees through cloud; accumulated warmth stops drought browning from being mistaken for harvest. Both satellites cover the world's farmland.
Model
Crop ID v2 labels every field. Phenology v2 reads each field's season from its greenness and radar signals.
Publish
Results go into a field database and map layers, served by a read-only API.
Use
In the Field Viewer, on the Regions page, or through the API.
Built to travel.
The core pipeline is designed to travel. A new region needs local field boundaries, crop definitions and reference data, but not a new monitoring system. In Great Britain the crop model learned from England's crop maps and was applied unchanged to Scotland and Wales. And accuracy in a new region is measured there, the same way it was in Great Britain, not assumed from it.
What travels unchanged
- The satellite inputs: Sentinel-1 and Sentinel-2, worldwide, back to 2017.
- The season model: emergence, green-up, peak, senescence, maturity and harvest read from each field's own signal.
- The Field Viewer, the Regions page and the API.
- The checks: fair, held-out tests against an independent reference, every year.
What we set up for each new region
- Field boundaries for the area to be covered.
- The local crop list and calendar: which crops matter, and when they are sown and harvested, including double cropping and more than one season a year.
- Ground truth: a set of known fields to train and test the crop model on.
- A reference to check against: a national survey, agency statistics or partner records.
- Local regions and soil map, so the regional view uses the boundaries and soils already in use there.
How a rollout runs
- Pilot. One area and one season, checked against the local reference.
- Back-fill. The same method run over every past season the archive covers, so every new region starts with a history, not a blank map.
- Scale. Country-wide, refreshed every few days through the season.
Desktop, tablet and phone.
On a phone, the map fills the screen and the field details sit in a sheet that you pull up. Every view has its own link, so a field, a date or a region can be shared just by sending the address.
From ministries to agronomists.
Ministries of agriculture and statistics offices
Crop areas and harvest progress for every field, between and ahead of survey rounds.
Food security and development programmes
Consistent, repeatable season monitoring across borders.
Grain traders, buyers and processors
Planting and harvest progress in every sourcing region, as it happens.
Insurers and lenders
An independent field-level record of what was grown and when it was cut.
Agronomists and advisers
Which fields are ahead or behind, before walking them.
Researchers
Field-level crop, phenology and soil data on one map.
Bringing Agribot to a new region starts with a pilot.
Validated against local records, then extended back through the satellite archive to build a field-level history.
Case study data: Great Britain, 2017 to 2026. Crop and phenology values: Agribot crop ID v2 and phenology v2. Crop areas compared with Defra's Cereal and Oilseed Production survey, October 2026 release. Field-level accuracy checked against the Rural Payments Agency's Crop Map of England, 2017 to 2024. Harvest timing compared with AHDB harvest reports, 2024 to 2026. Soils data © Cranfield University (NSRI) and for the Controller of HMSO, 2026. Base maps: Esri. Screenshots from Field Viewer v2 with 2025 and 2026 data.