A grass growth forecast
for every field.
Measured from space, through cloud, with no hardware on your farm.
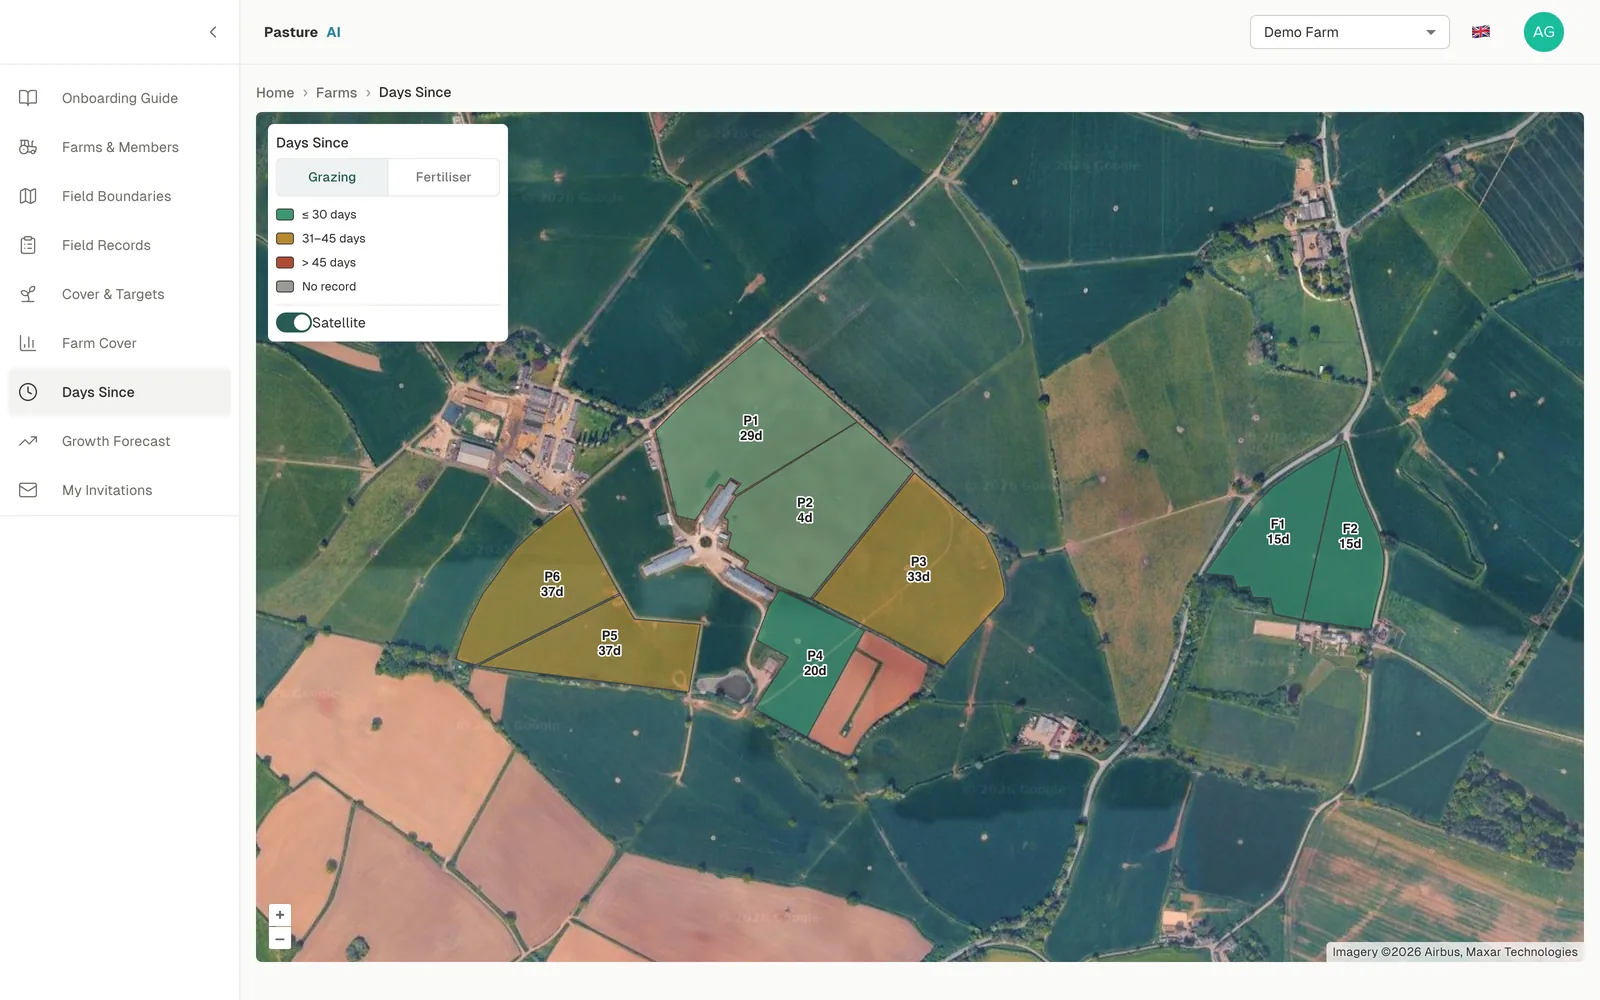
Measuring grass by walking the fields takes farmers around 8 hours a week.
Plate meters and walks give a reading for the day you measured. They don't tell you what each field will do next week, and they take time you could spend on the farm.
Pasture AI reduces how much of that measuring you need to do. Radar satellites measure through cloud, day or night, with no hardware on your farm. A model built for your farm learns how each of your fields has responded in the past, to forecast dry-matter yield two weeks out and growth trends 4 weeks in advance.
Proven on working farms
Results from Agribot's work on working UK dairy farms.
Not a regional average. A model of your own fields, trained on their history.
Each field's past growth, grazing and fertiliser records shape its forecast, and every cover you record sharpens it.
So you can decide which paddock to graze next, when to cut and where to hold grass with more confidence, and utilise more of what you grow.
Three views, each tied to a decision.
Field records
Which fields recover fastest after grazing, and where inputs pay back in growth.
Farm cover
Which paddock the herd goes into next, and whether you are heading into a surplus or a deficit.
Growth forecast
When each field reaches its target, and how to adjust the rotation before weather bites.
Here's what each feature shows, and the decisions it supports, on one working farm.
Every field's history, in one place.
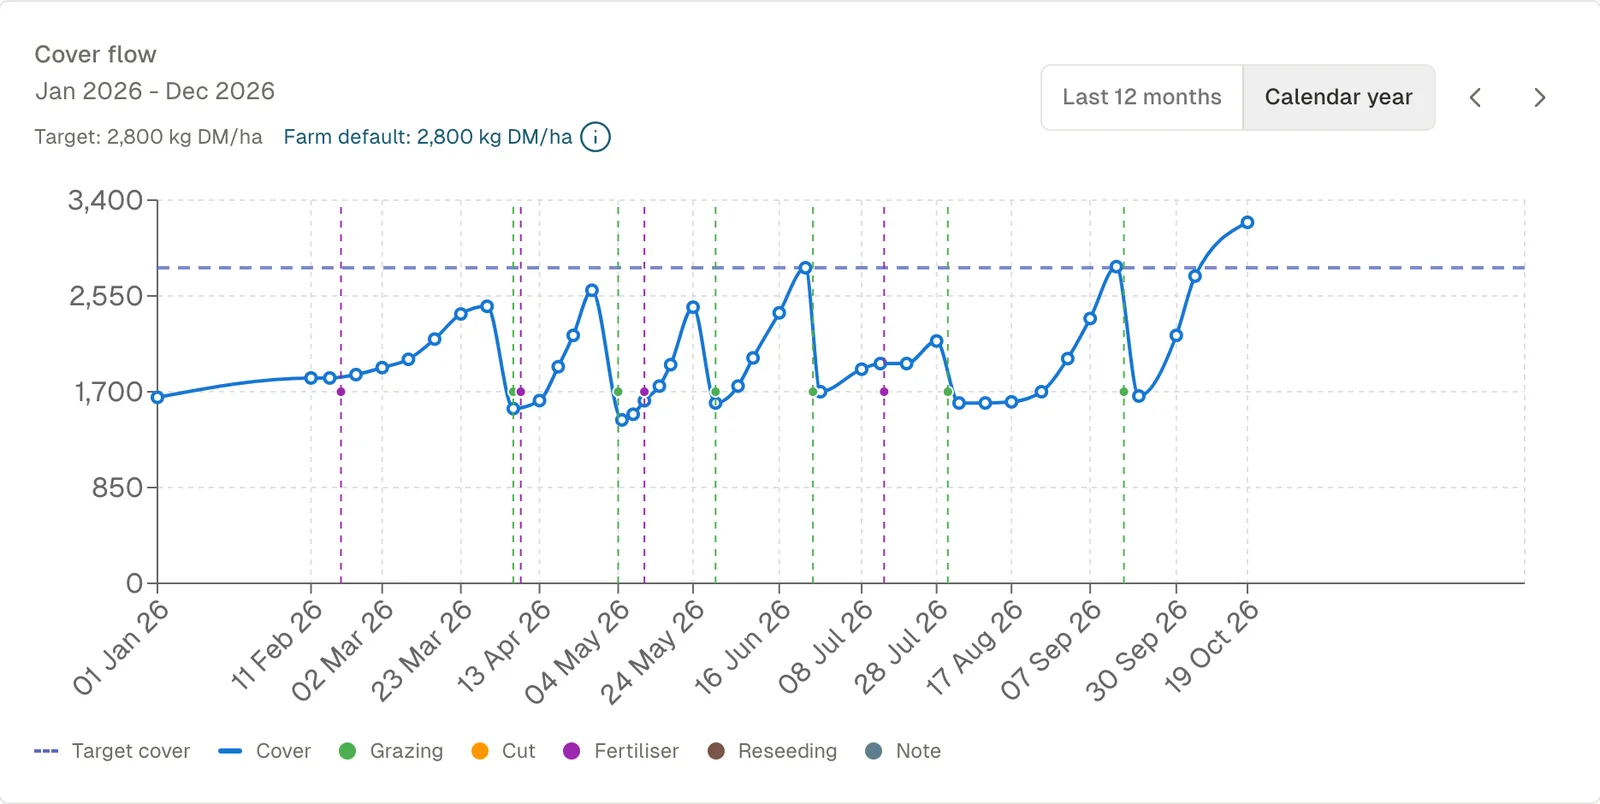
Each field keeps a running record of cover, grazing, cuts, fertiliser, reseeding and notes, alongside its satellite-measured growth. That history is what your farm's model learns from.
What you see
- Cover flow. Each field's cover through the season, against its target.
- Events. Grazing, cuts, fertiliser and reseeding on the same timeline.
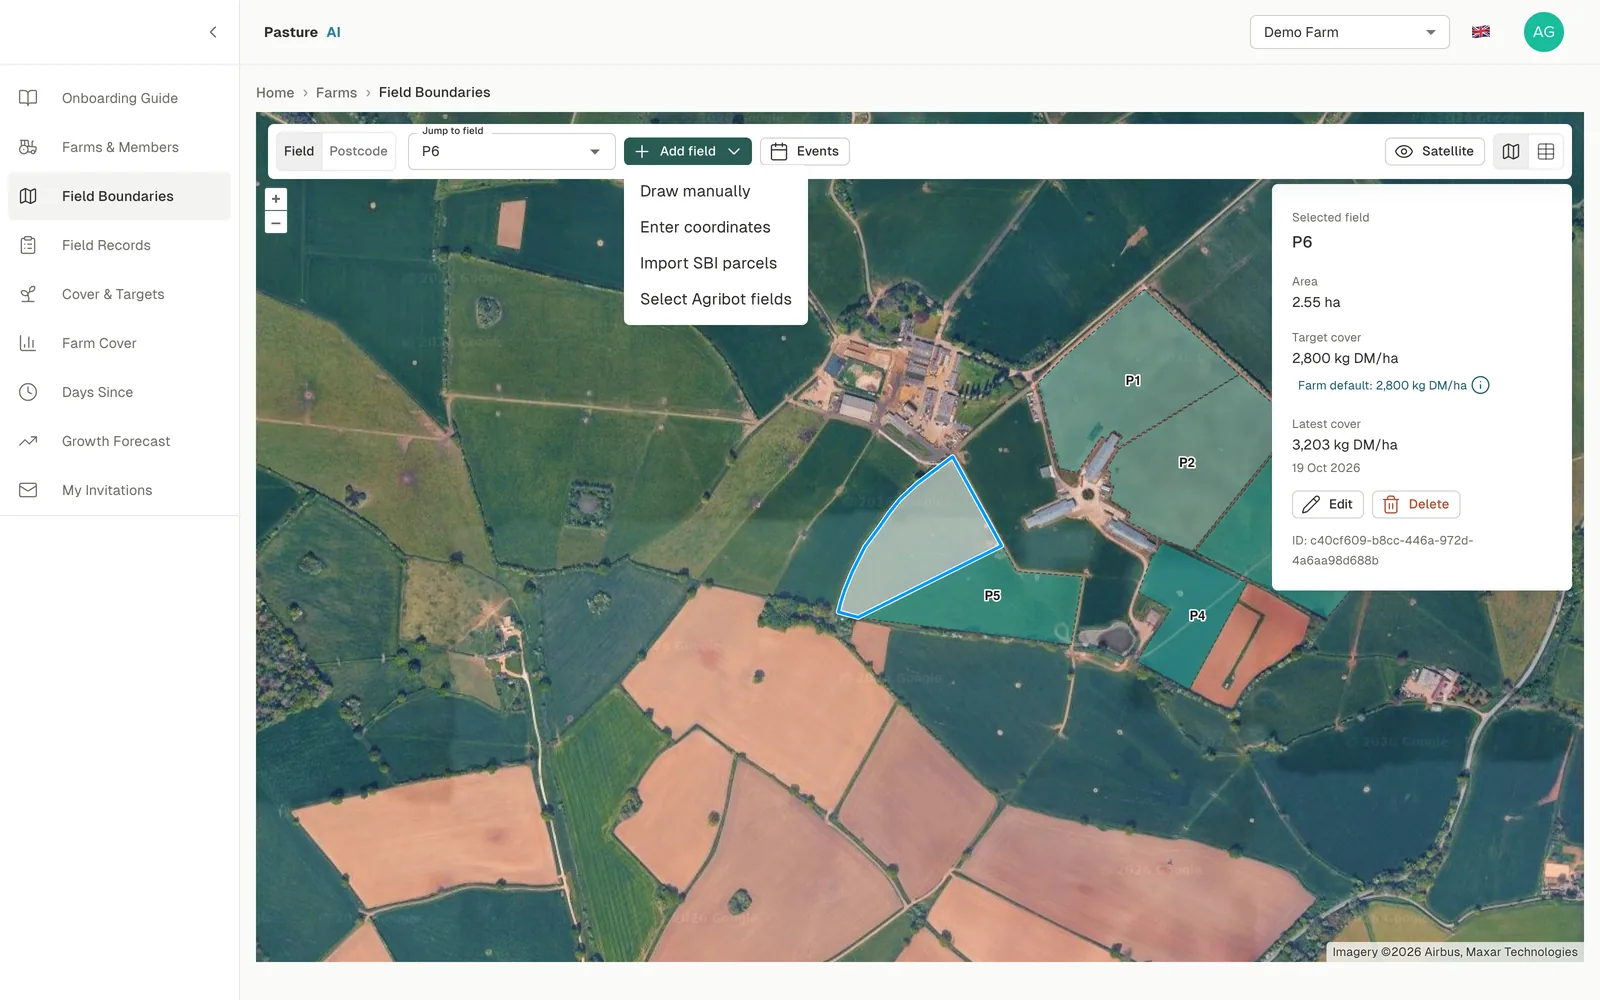
- Every field. From the Agribot map, your own boundaries or your farm software.
Decisions it supports
- Which fields recover fastest after grazing, and which lag.
- Where fertiliser is paying back in growth.
- Which fields are falling behind and due a reseed.
That's every grazing, cut and fertiliser application on one timeline, field by field.
How much grass you have, and where.
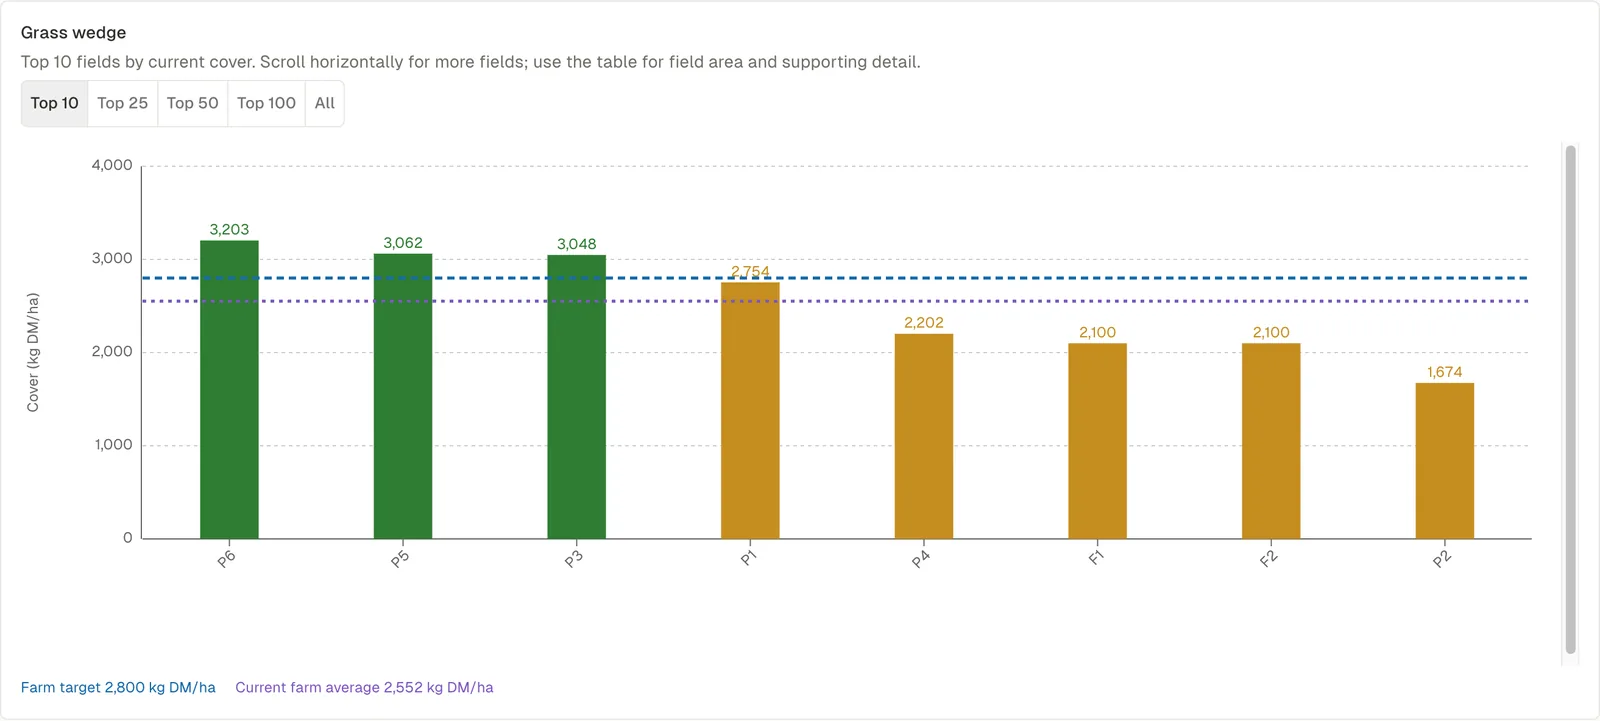
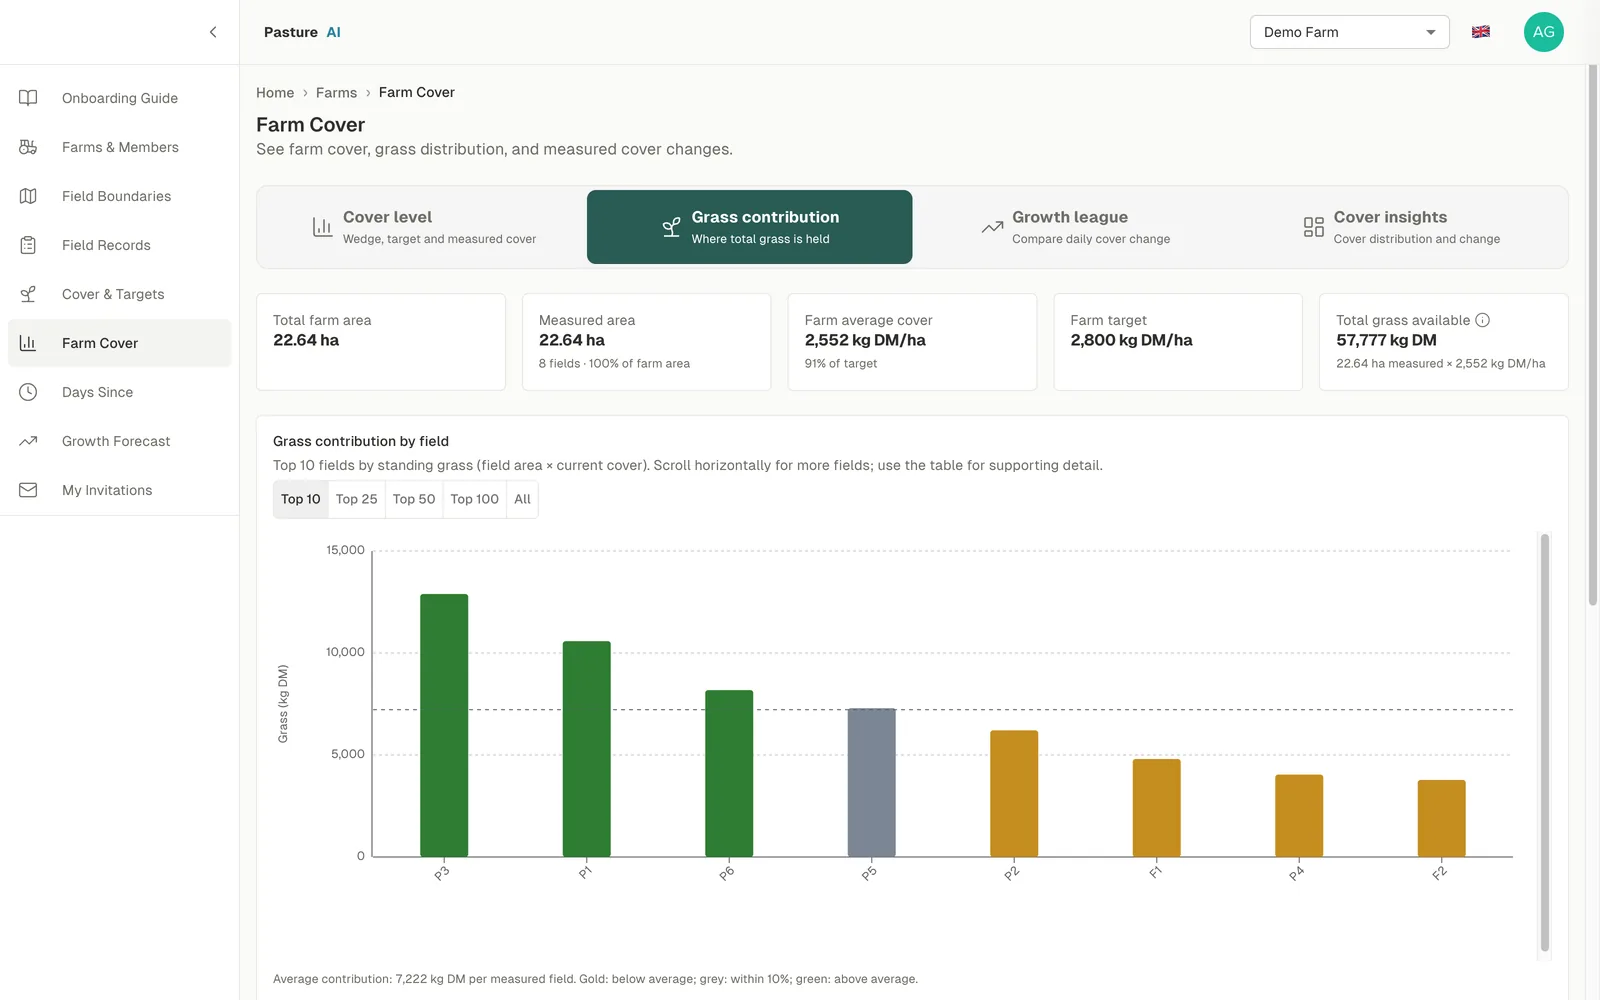
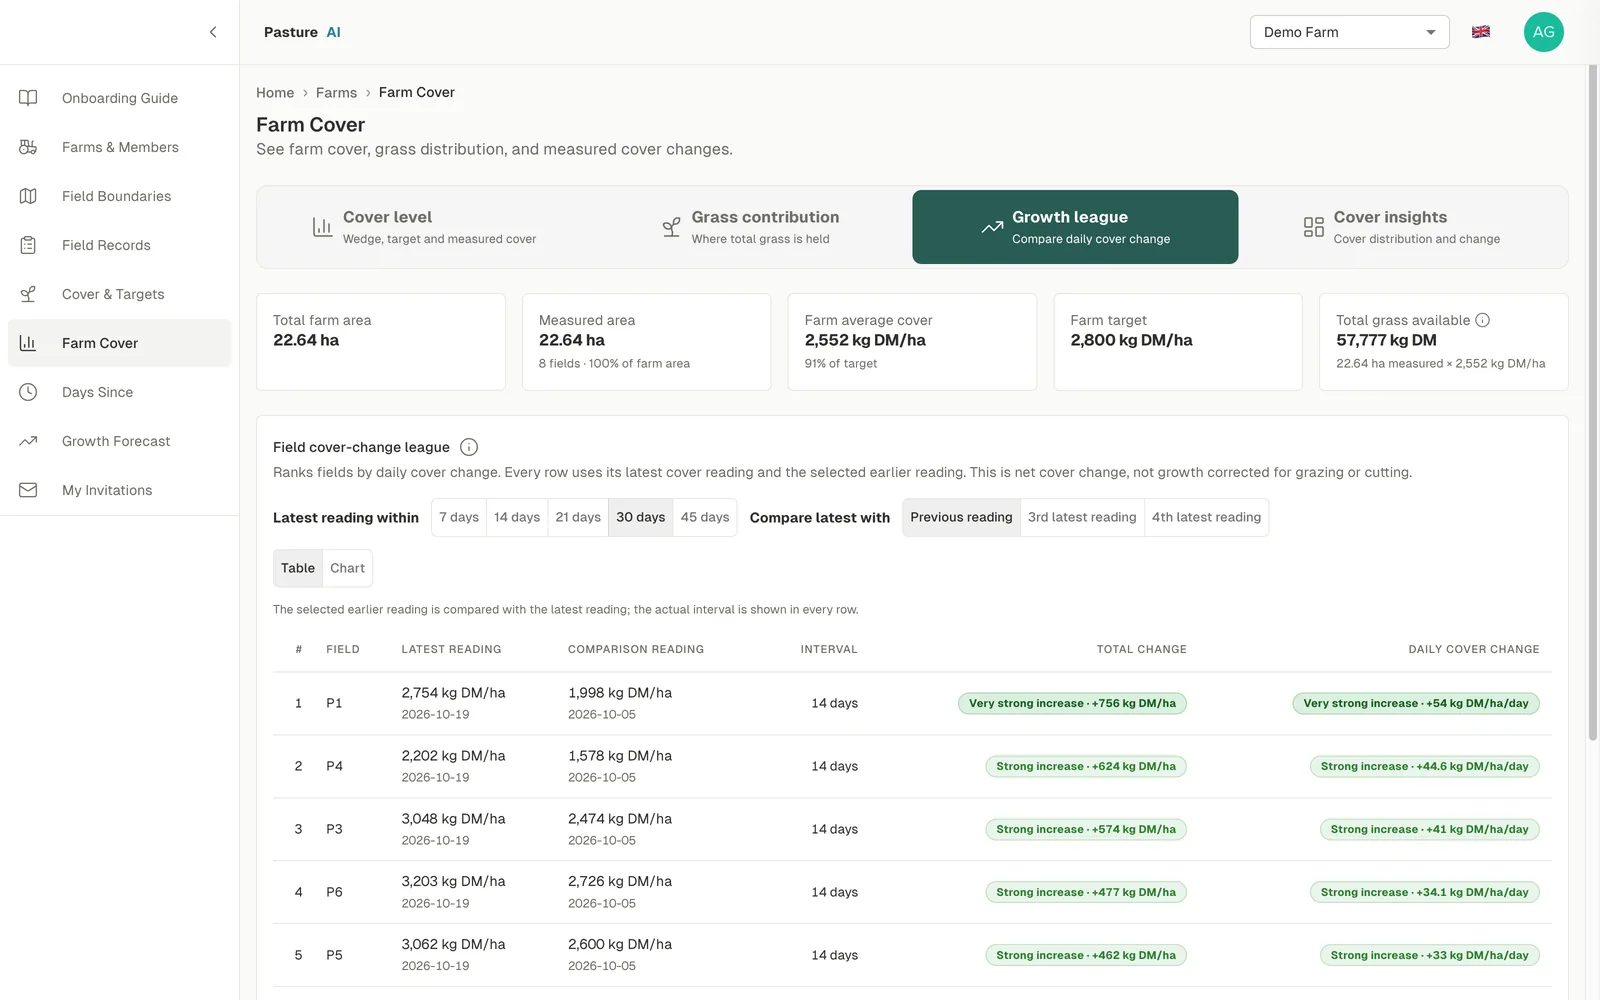
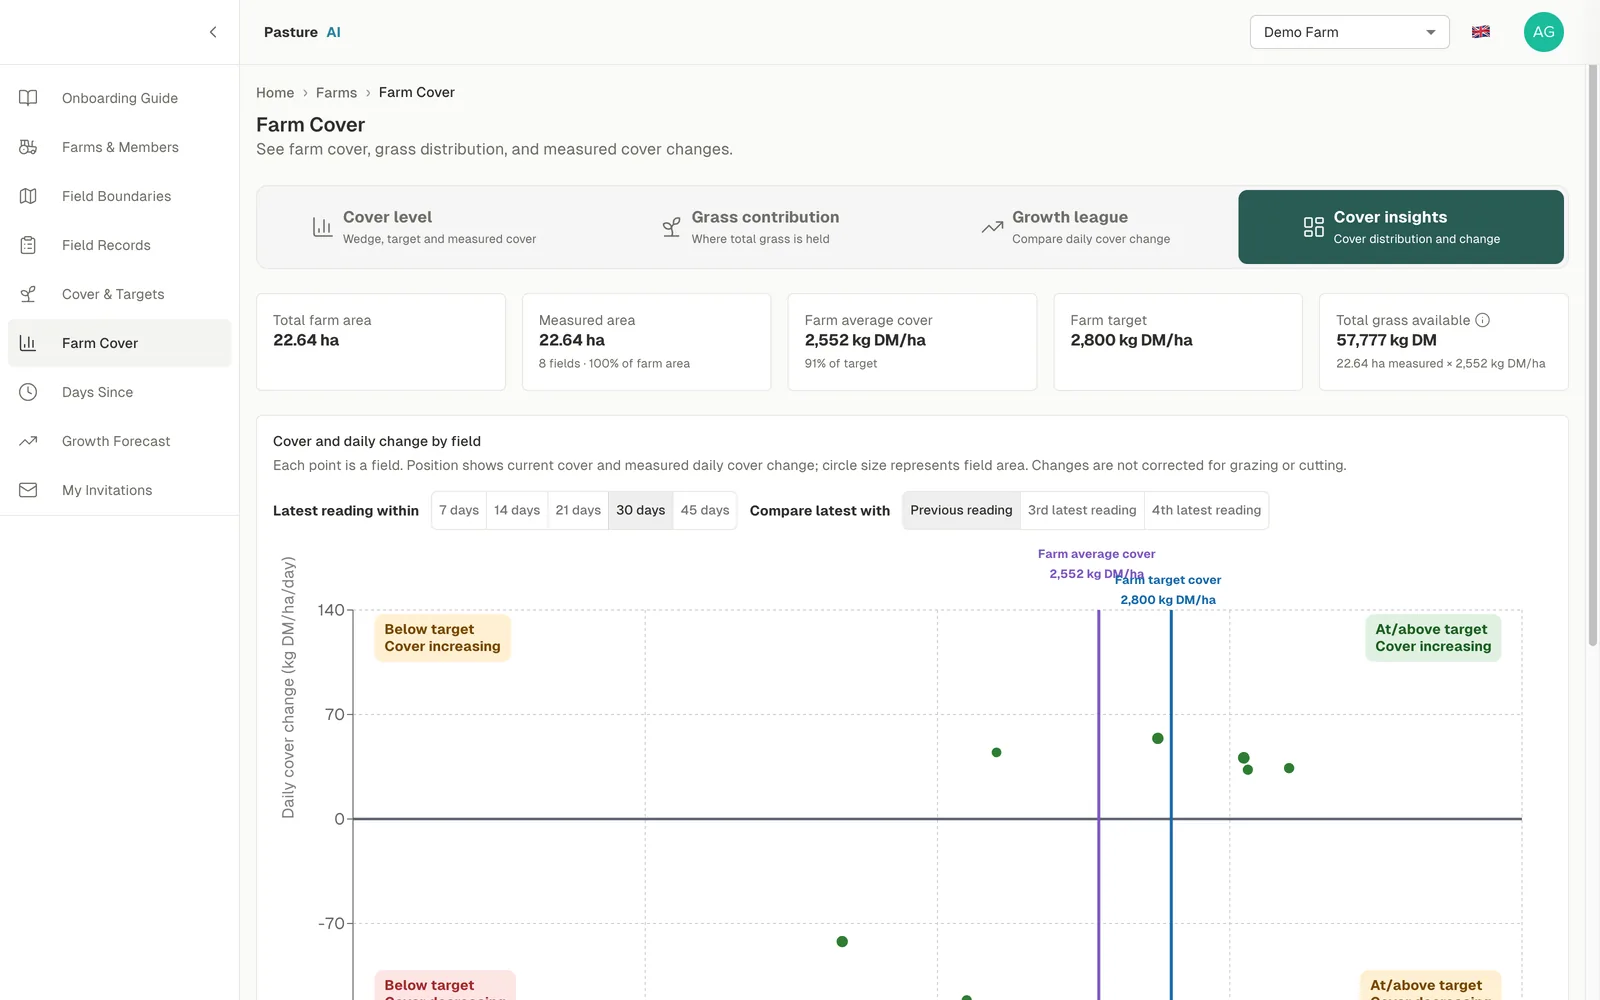
Farm Cover shows the total farm area, measured area, farm average cover, farm target and total grass available. The grass wedge ranks fields by current cover, with the farm target and the farm average. Read alongside the forecast, it shows where the farm is heading over the weeks and months ahead, not just tomorrow's grazing.
What you see
- Cover level. Wedge, target and measured cover.
- Grass contribution. Where total grass is held.
- Growth league. Daily cover change, field against field.
- Cover insights. Cover distribution and change.
Decisions it supports
- Which paddock the herd goes into next.
- Whether you are heading into a surplus or a deficit over the coming weeks.
- How much grass to build ahead of the next stage of the season: turnout, peak growth or closing up for winter.
- When to take surplus out as silage, or bring in supplement.
- Whether to speed up or slow down the rotation.
That's planning the season ahead, not just tomorrow's paddock, without walking the farm first.
How much you'll have, and when.
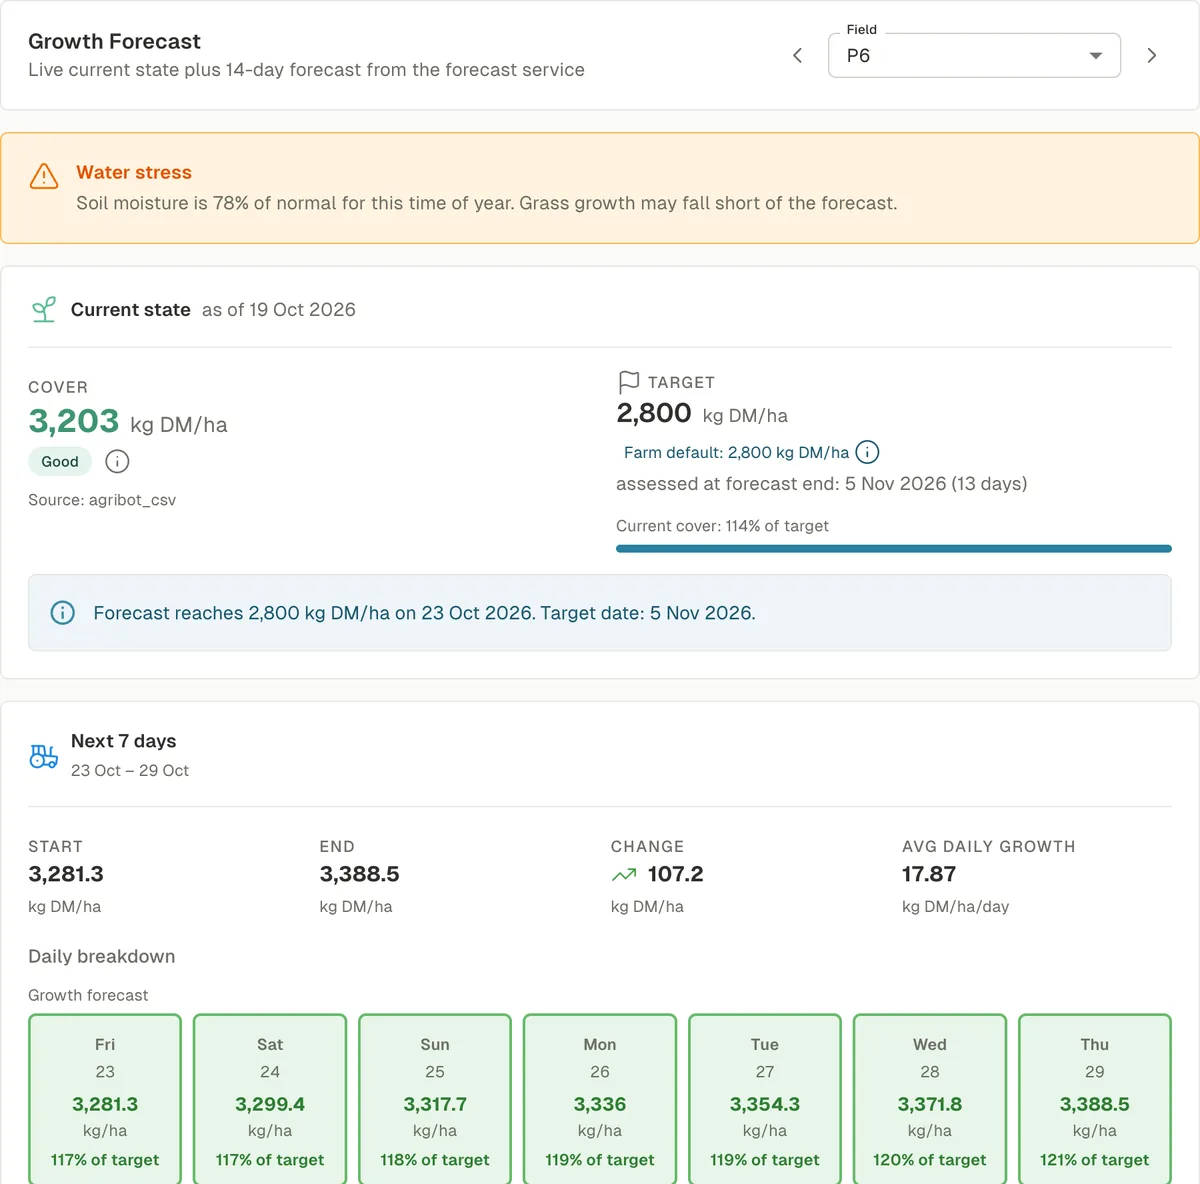
Growth Forecast shows each field's current cover and target, the date the forecast reaches the target, and growth forecast for the next 14 days. Early warning for extreme weather events.
What you see
- Target date. When the forecast reaches target cover.
- Next 7 days. Start, end, change and average daily growth, day by day.
- Weather. A warning when extreme weather may affect growth.
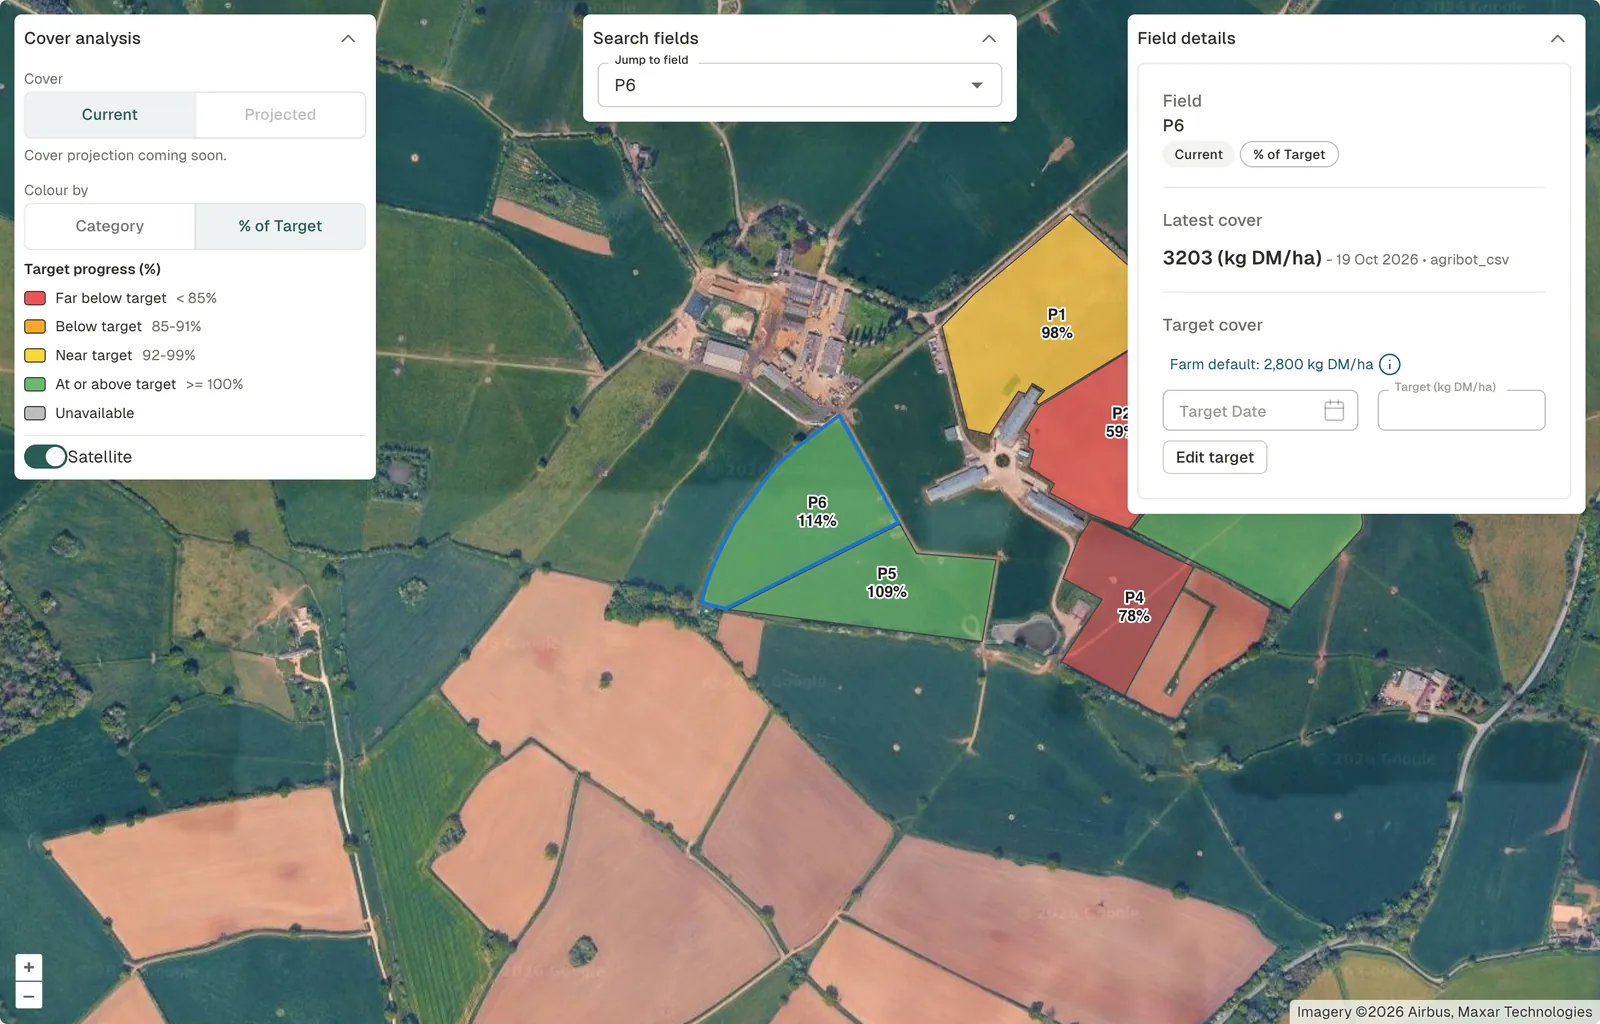
- Whole farm. Projected cover for every field on the map, by cover category or % of target.
Decisions it supports
- When each field will be ready to graze.
- How long the current rotation can run.
- Whether to ease stocking or hold fertiliser through a dry spell.
- The next round of grazing, planned on projected cover, not today's.
That's seeing a dry spell coming, and adjusting the rotation before cover falls short.
From satellite pass to grazing plan.
Observe
C-band radar satellites measure every field through cloud, day or night. No sensors or hardware on the farm.
Model
A model built for your farm learns from each field's own history of growth, grazing and fertiliser, and calibrates to the covers you record.
Forecast
Dry-matter yield two weeks out, growth trends 4 weeks ahead, and warnings of extreme weather and water stress.
Publish and use
Results go into a field database served by an API: in the Pasture AI app, or in your own systems.
On the farm, and across the supply chain.
Dairy farmers
Cover, wedge and rotation planning, with less time measuring.
Beef and sheep farmers
When each field will be ready to graze or cut.
Advisers
Every client farm's cover and forecast in one place.
Dairy co-operatives
Grass supply across every member farm, and early warning of a shortfall.
Supply chains
The forage outlook behind milk and meat supply, ahead of the season.
Software providers
Field-level cover and growth forecasts through the API.
API-driven, built to integrate.
Pasture AI is API-driven. Farms, fields, events and forecasts go into a field database served by an API, so the same results that drive the app can sit inside the farm management software, advisory tools and supplier platforms you already use.
What the API serves
- Farms, members and field boundaries.
- Field events: cover, grazing, cuts, fertiliser, reseeding and notes.
- Current and projected cover for every field.
- The 7-day growth forecast, target dates and water-stress warnings.
What it connects to
- Farm management software, for field boundaries and events in both directions.
- Advisory platforms, for every client farm's cover and forecast in one place.
- Processor and co-op tools, for grass supply across a supplier base.
How an integration runs
- Connect. Farms and field boundaries come in from your system, or are added on the Agribot map.
- Back-fill. Each field's history is read from the satellite archive, so every farm starts with a history, not a blank map.
- Run. Cover and forecasts refresh automatically and flow back into your system through the API.
Start with your own fields.
Add your farm, record a few covers, and see the forecast for the next two weeks.
Figures from Agribot's work on working UK dairy farms. Satellite imagery ©2026 Airbus, Maxar Technologies. Screenshots from Pasture AI with 2026 data.